Report · May 4, 2023
Global Warming’s Four Indias, 2022: An Audience Segmentation Analysis
By Anthony Leiserowitz, Jagadish Thaker, Matthew Goldberg, Matthew Ballew, Seth Rosenthal, Jennifer Carman, Liz Neyens, Sanguk Lee, Yashwant Deshmukh, Gaura Shukla and Jennifer Marlon
Filed under: Beliefs & Attitudes, Policy & Politics, Behaviors & Actions and Audiences
6. Local Weather Events: Observations, Vulnerabilities, and Resilience
India is a geographically diverse country. Different areas experience different levels of heat, rainfall, and extreme weather. Questions about local weather events, vulnerabilities, and resilience include observations about changes in local weather (e.g., average rainfall), frequency of extreme local weather events (e.g., droughts), and capacity to recover from extreme weather events (e.g., length of recovery time, financial challenges).
Alarmed
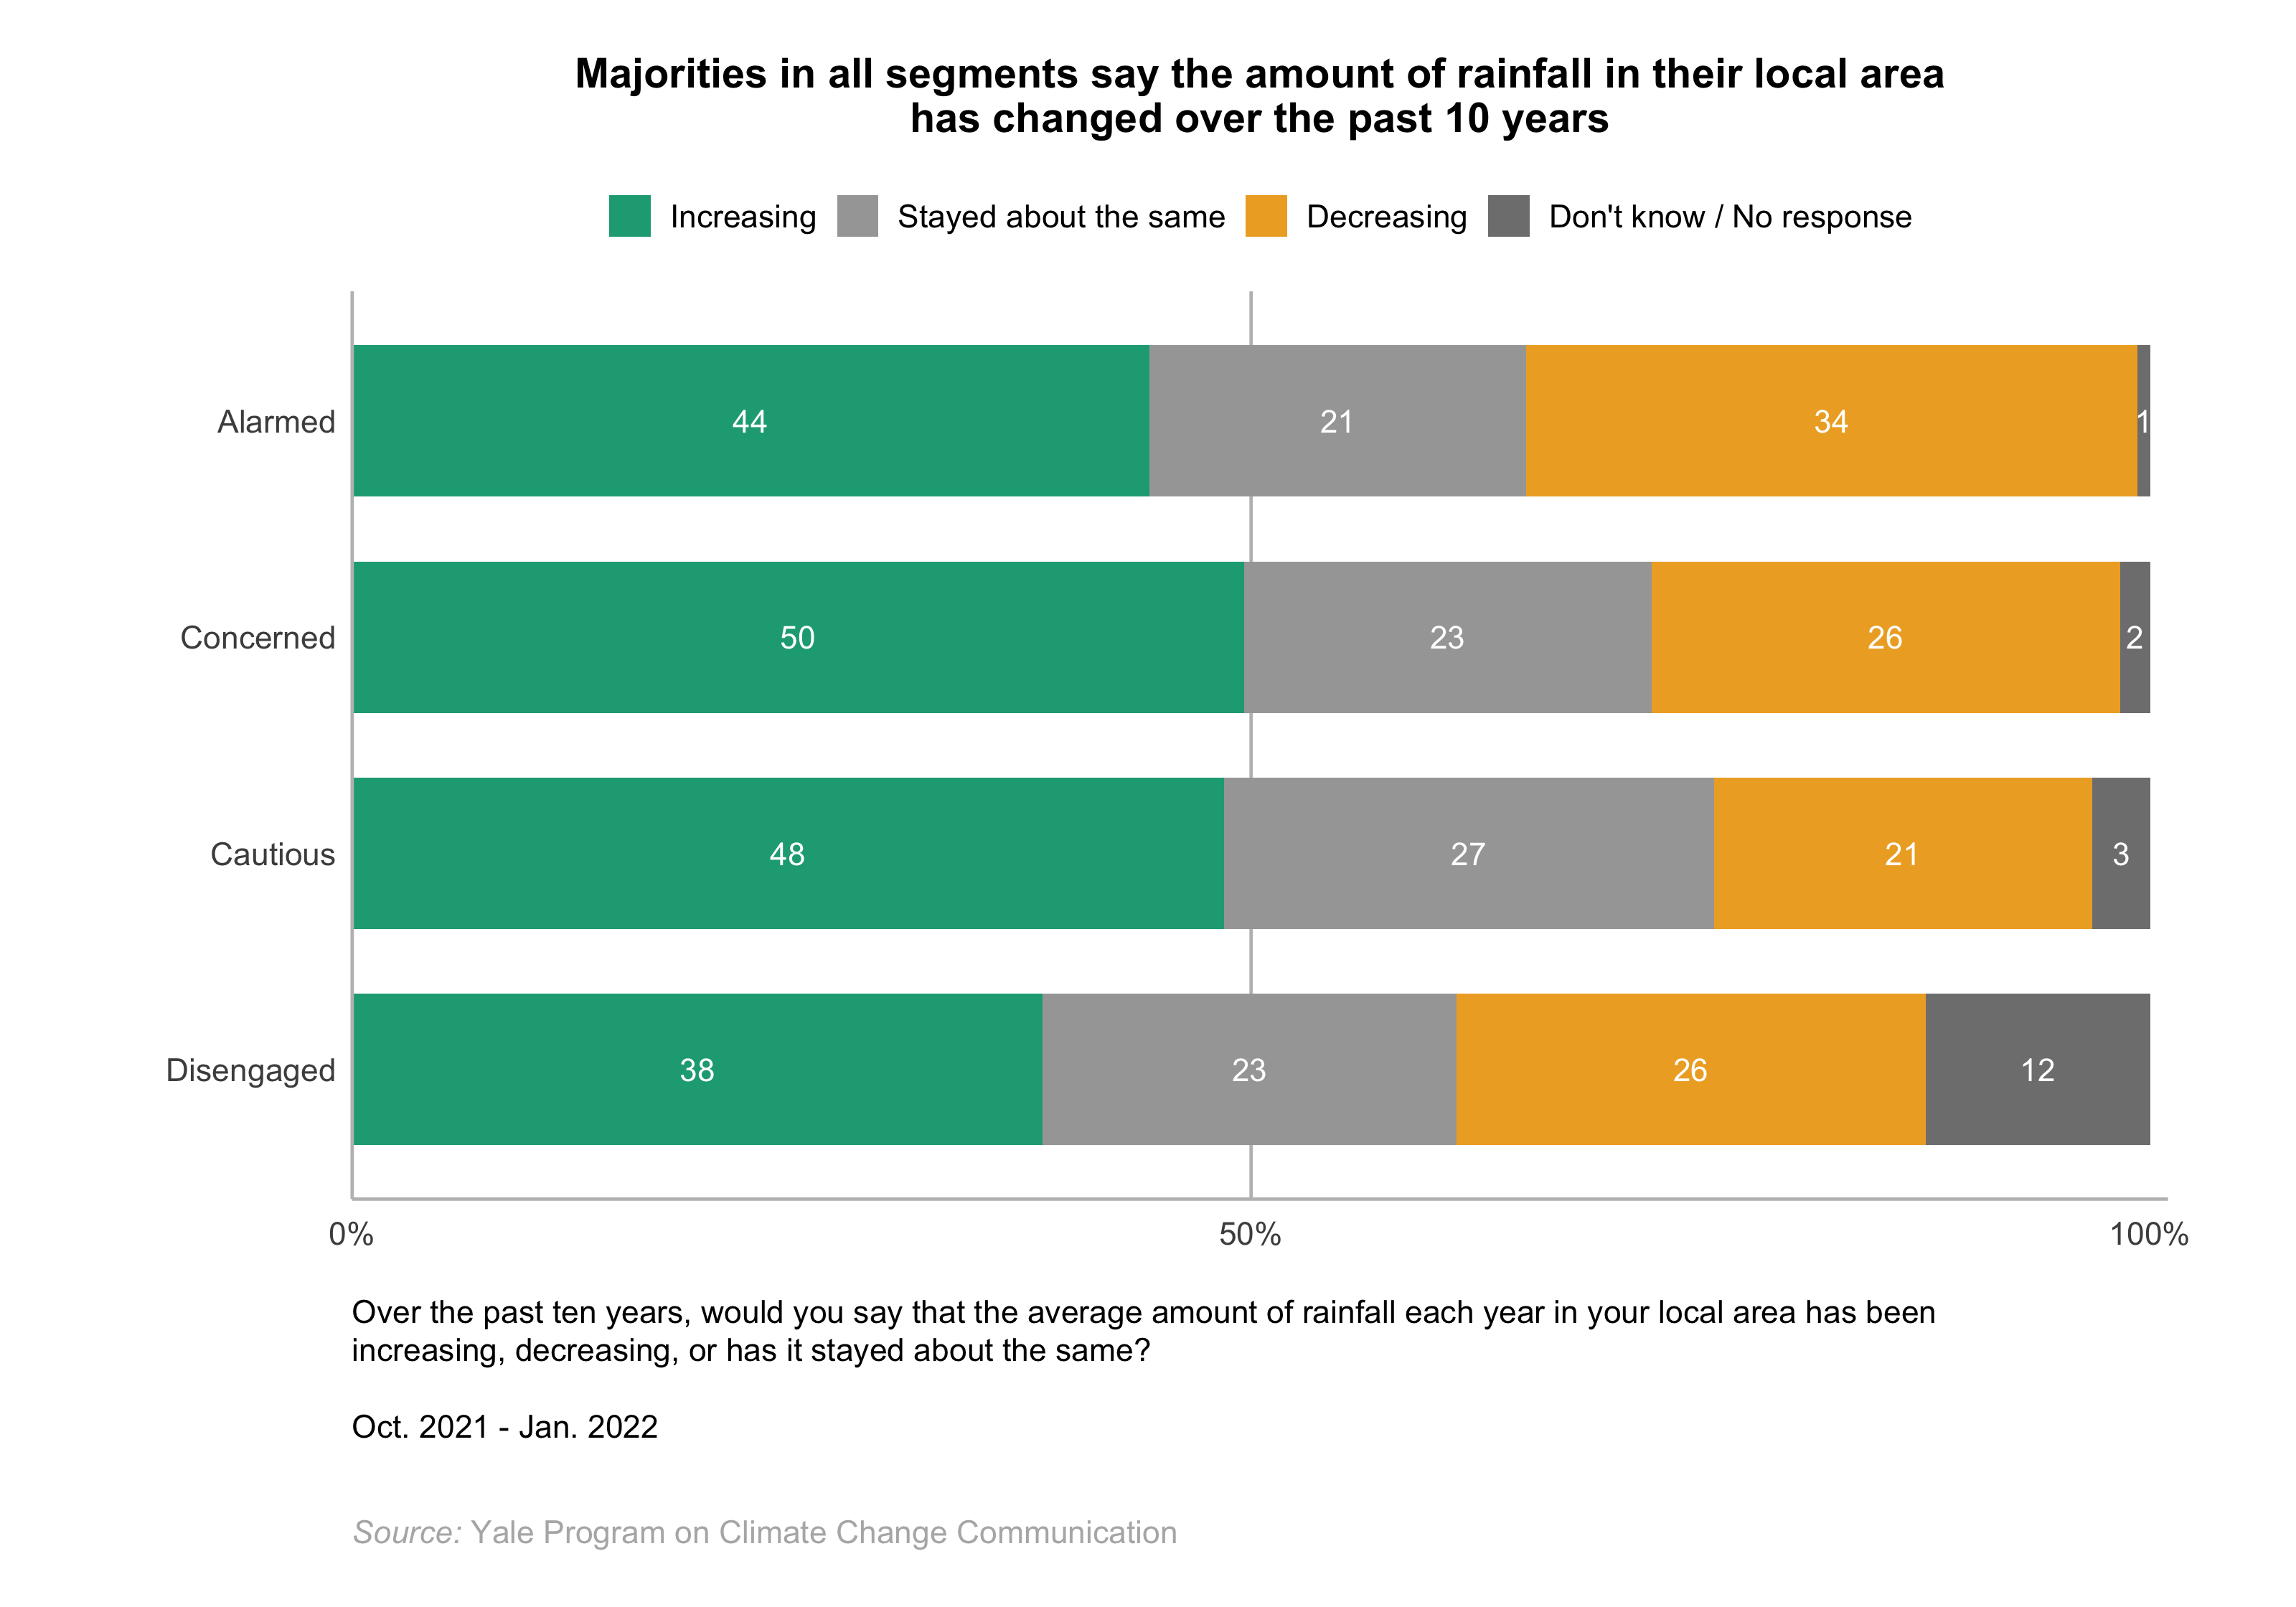
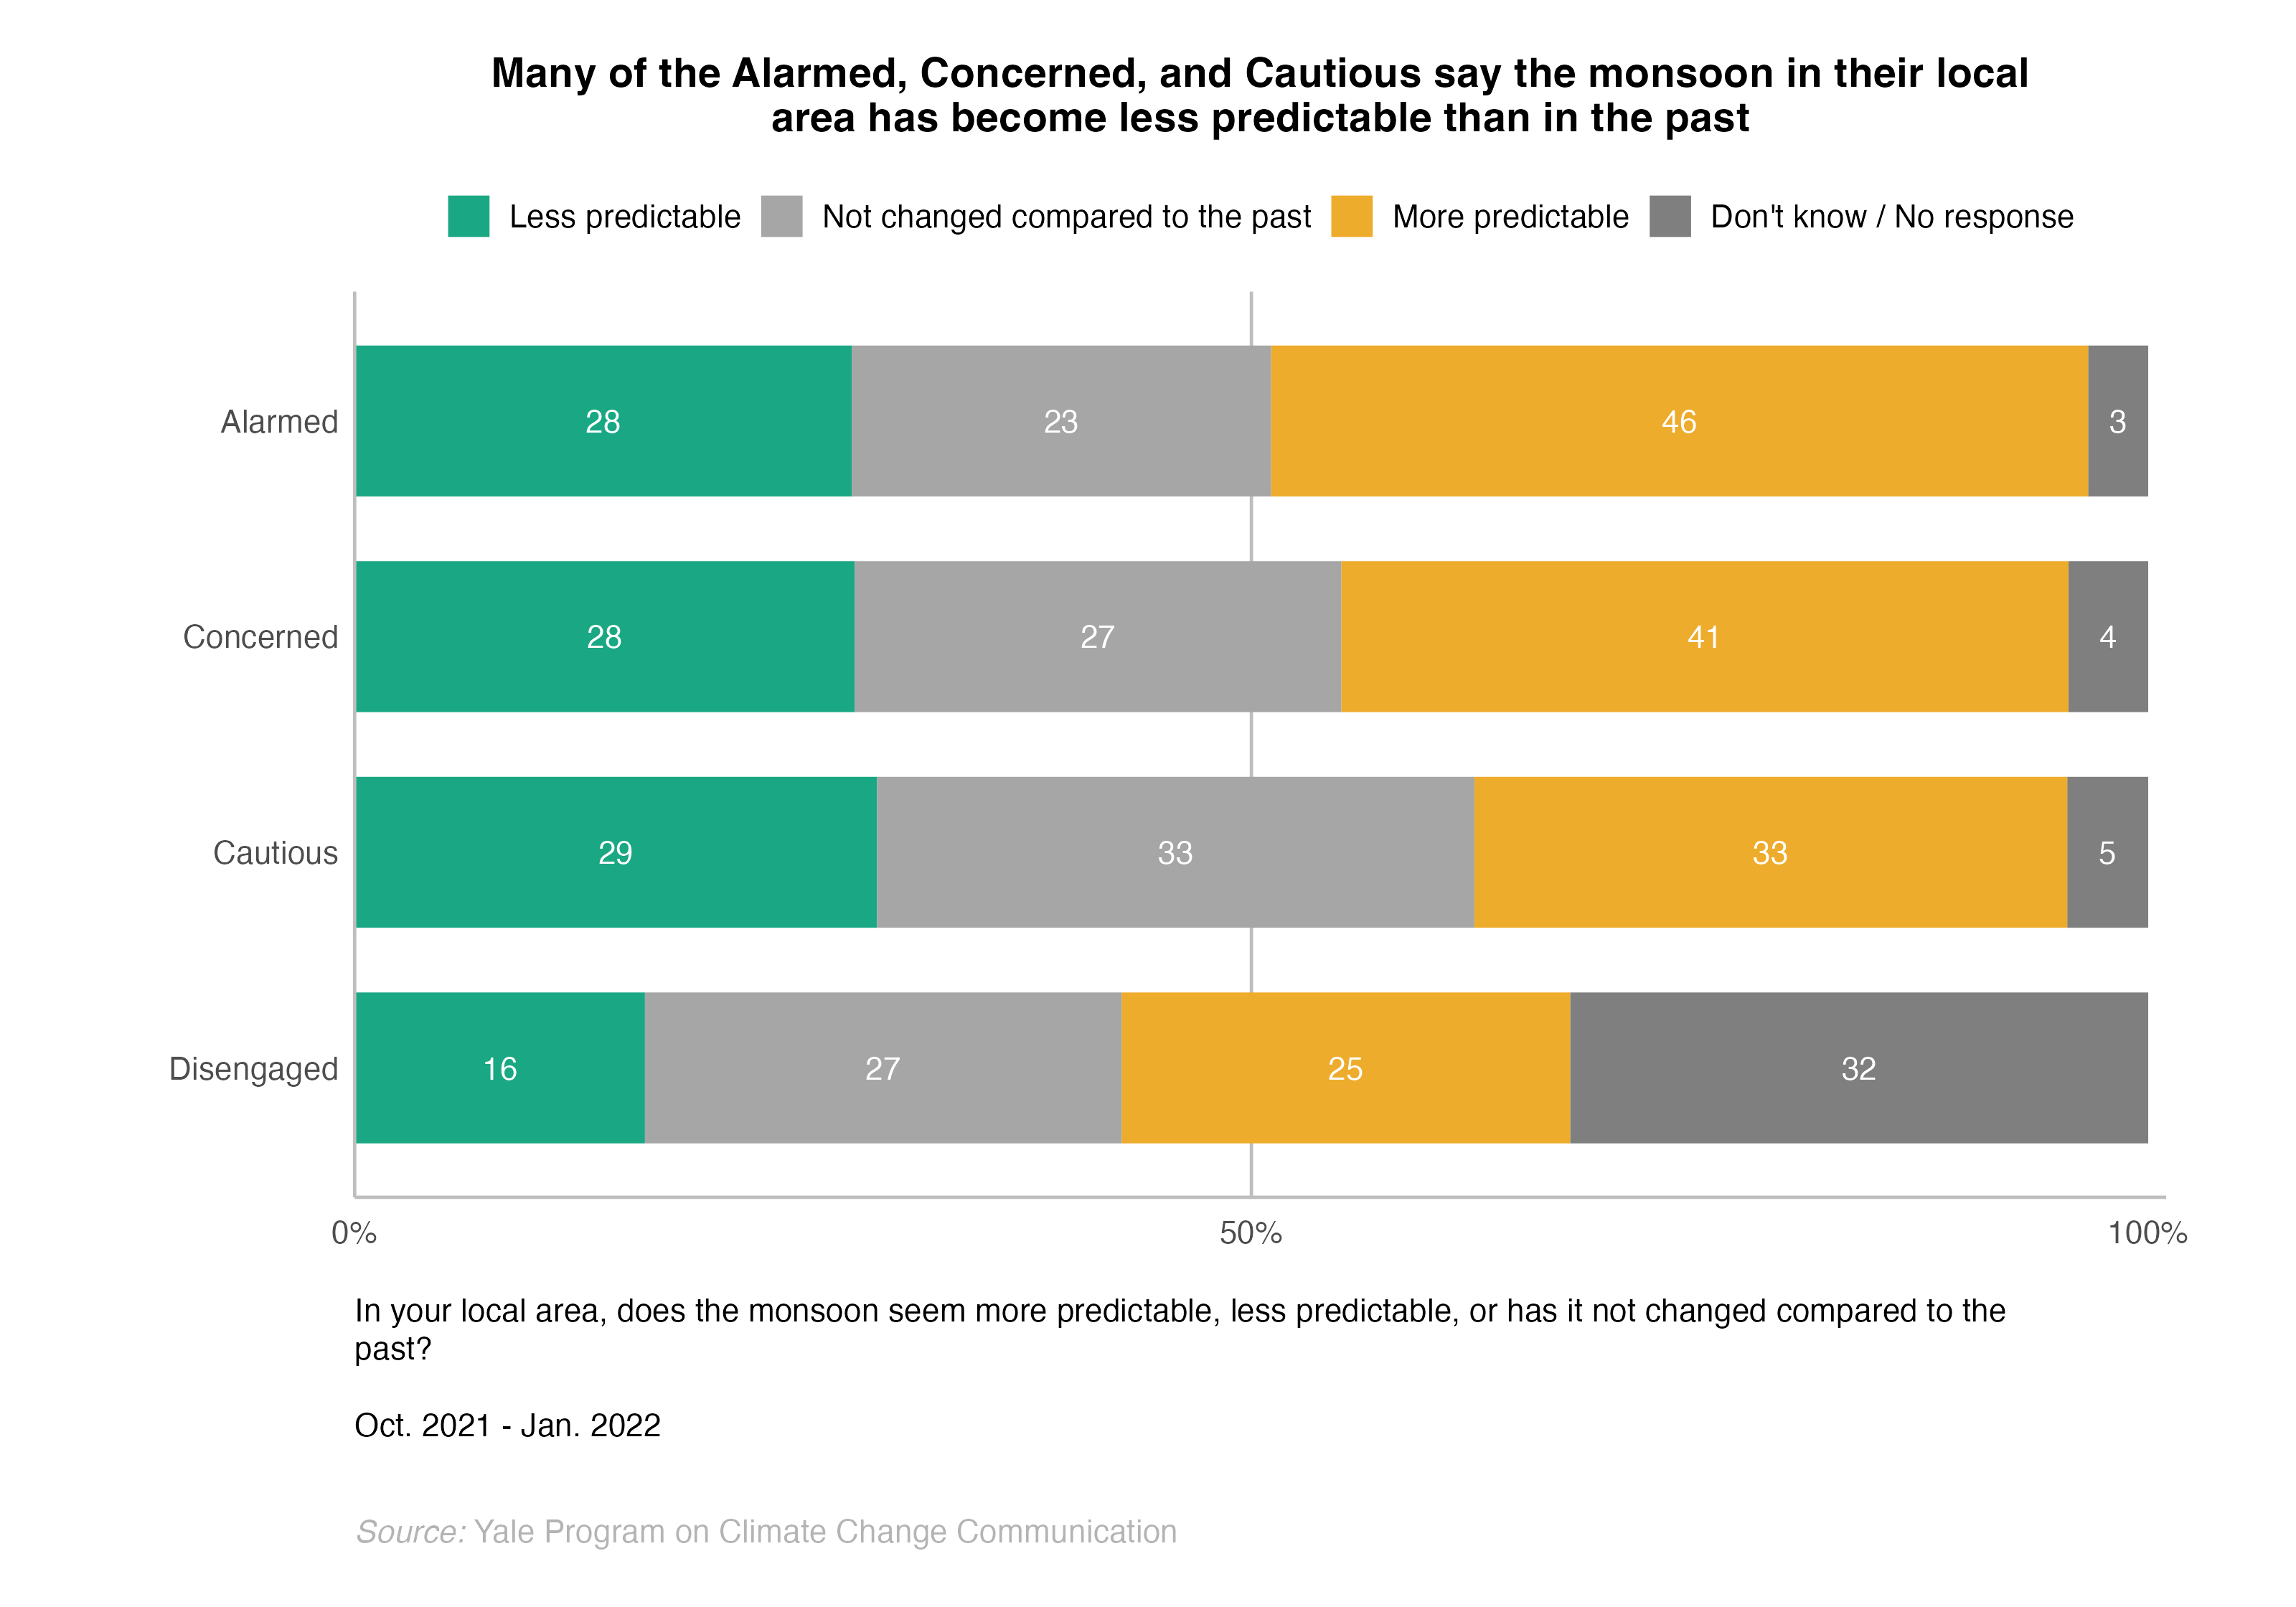
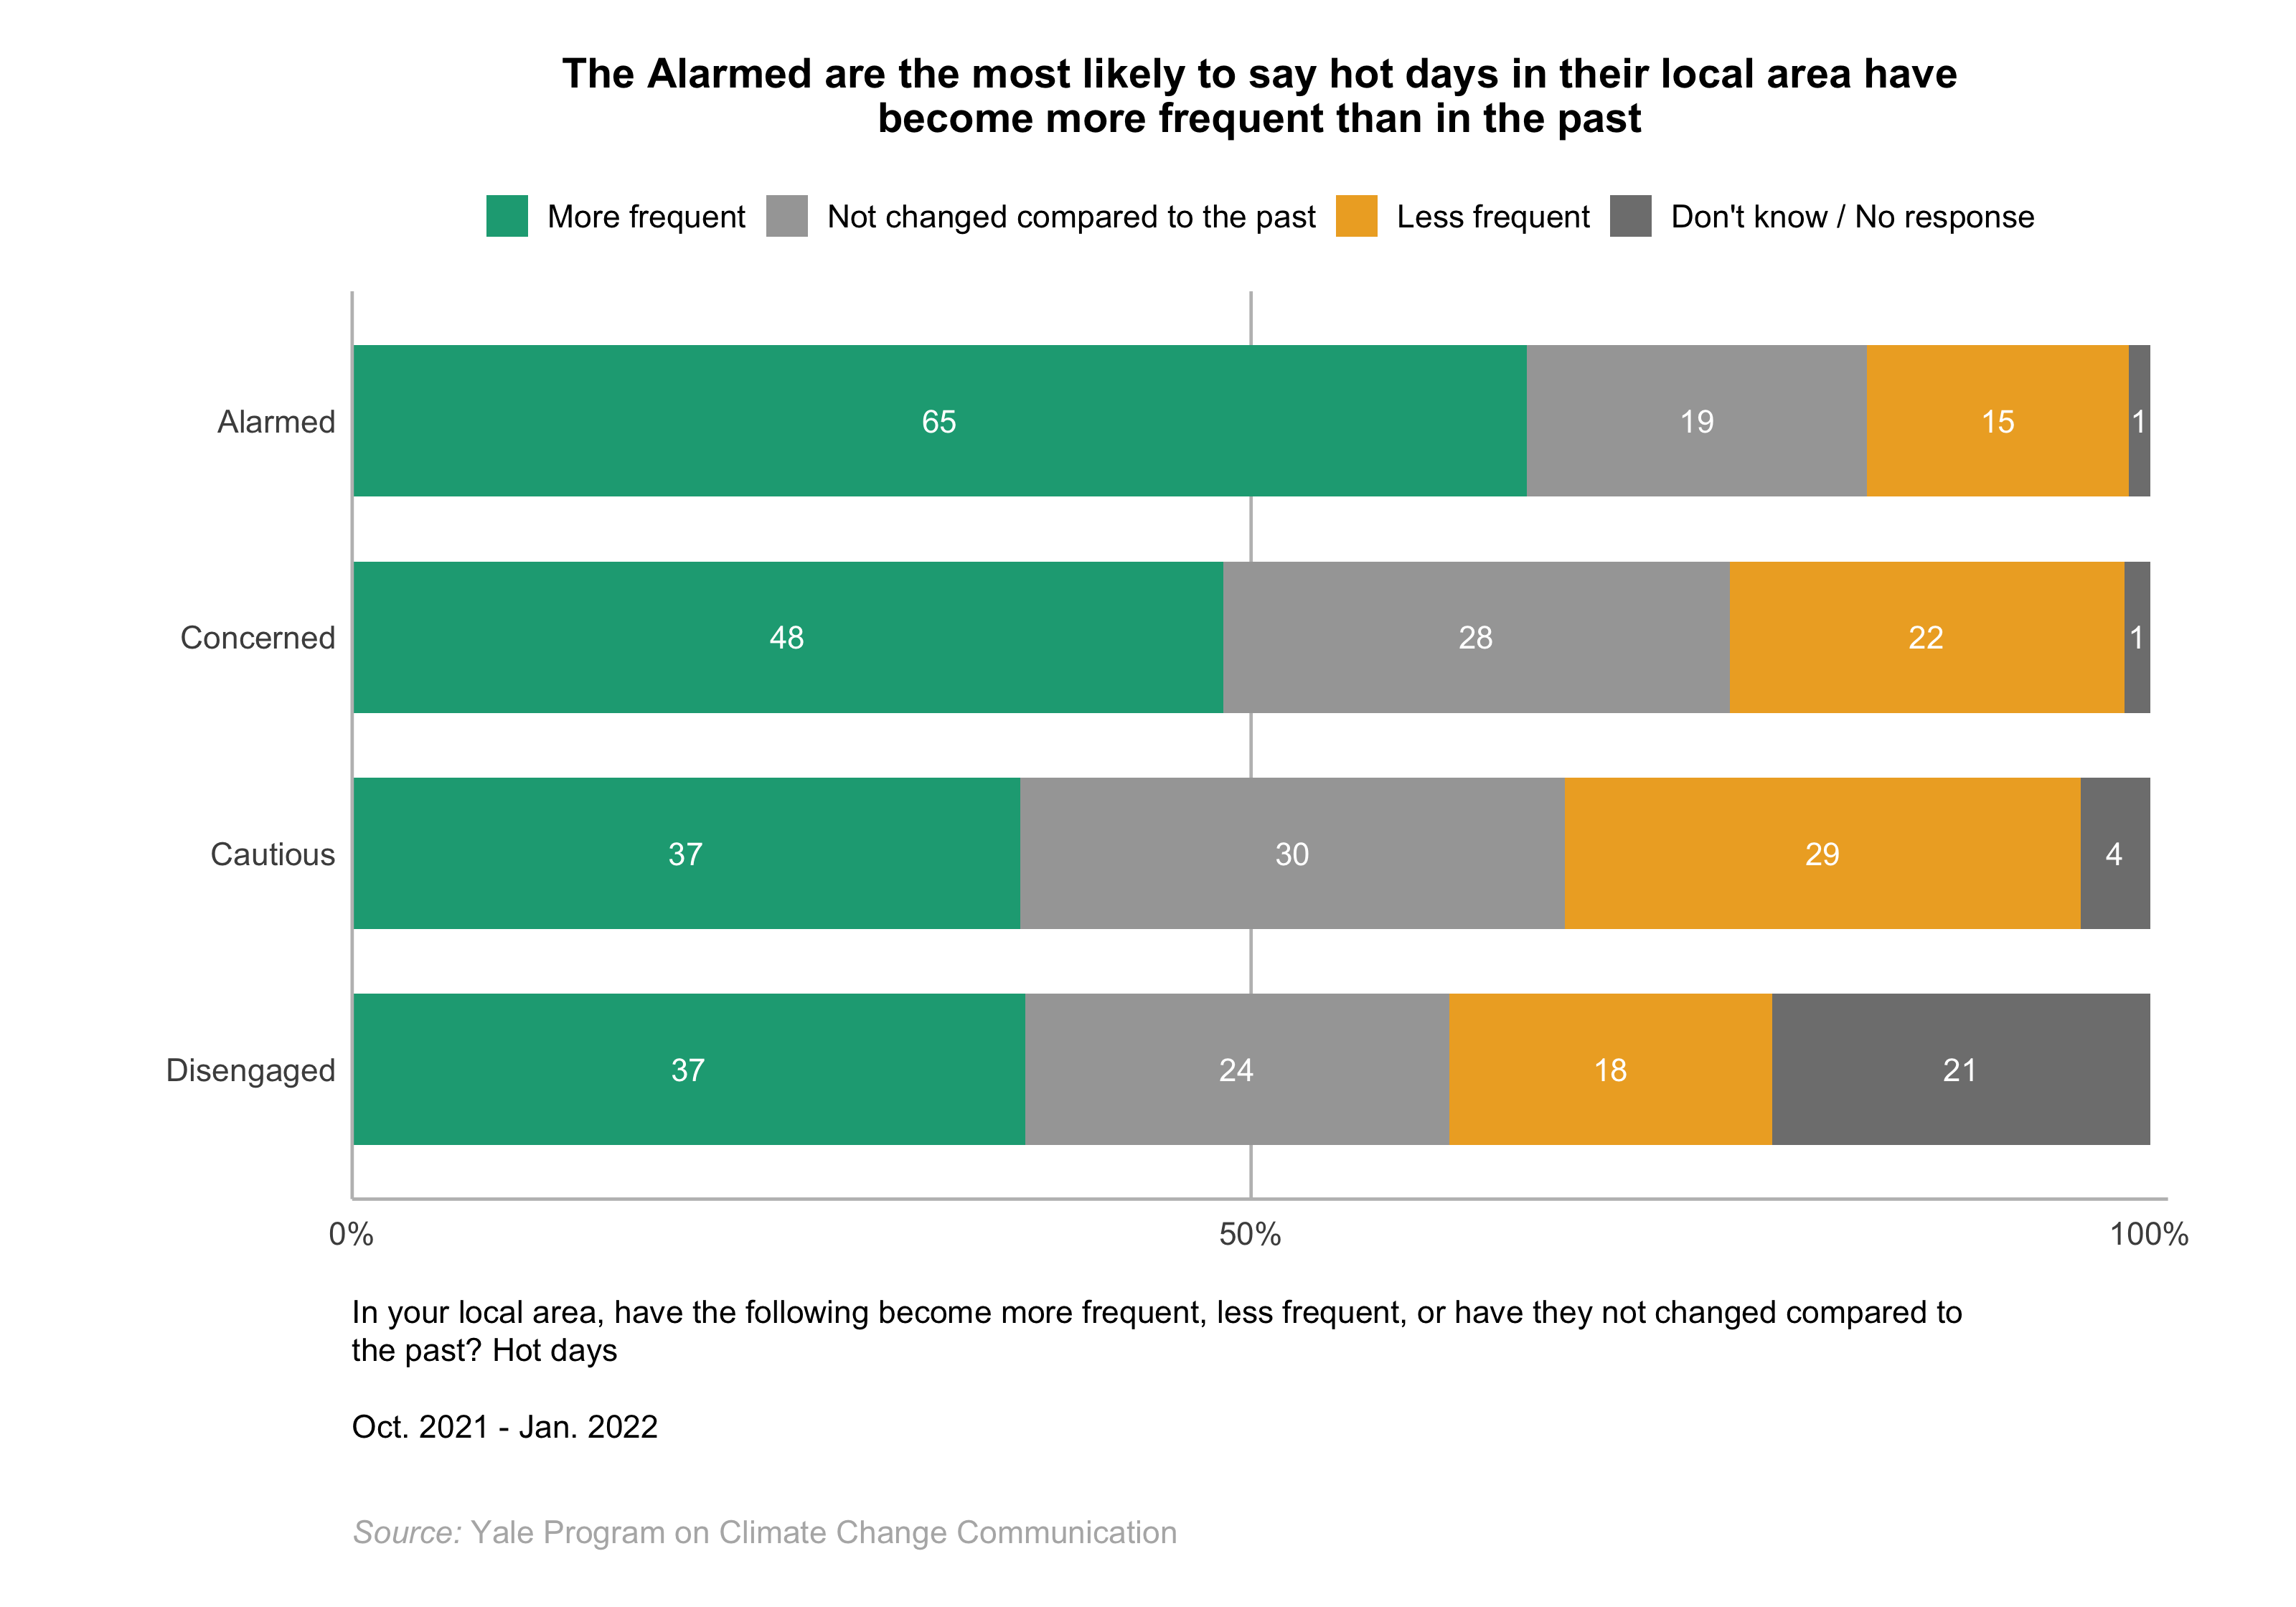
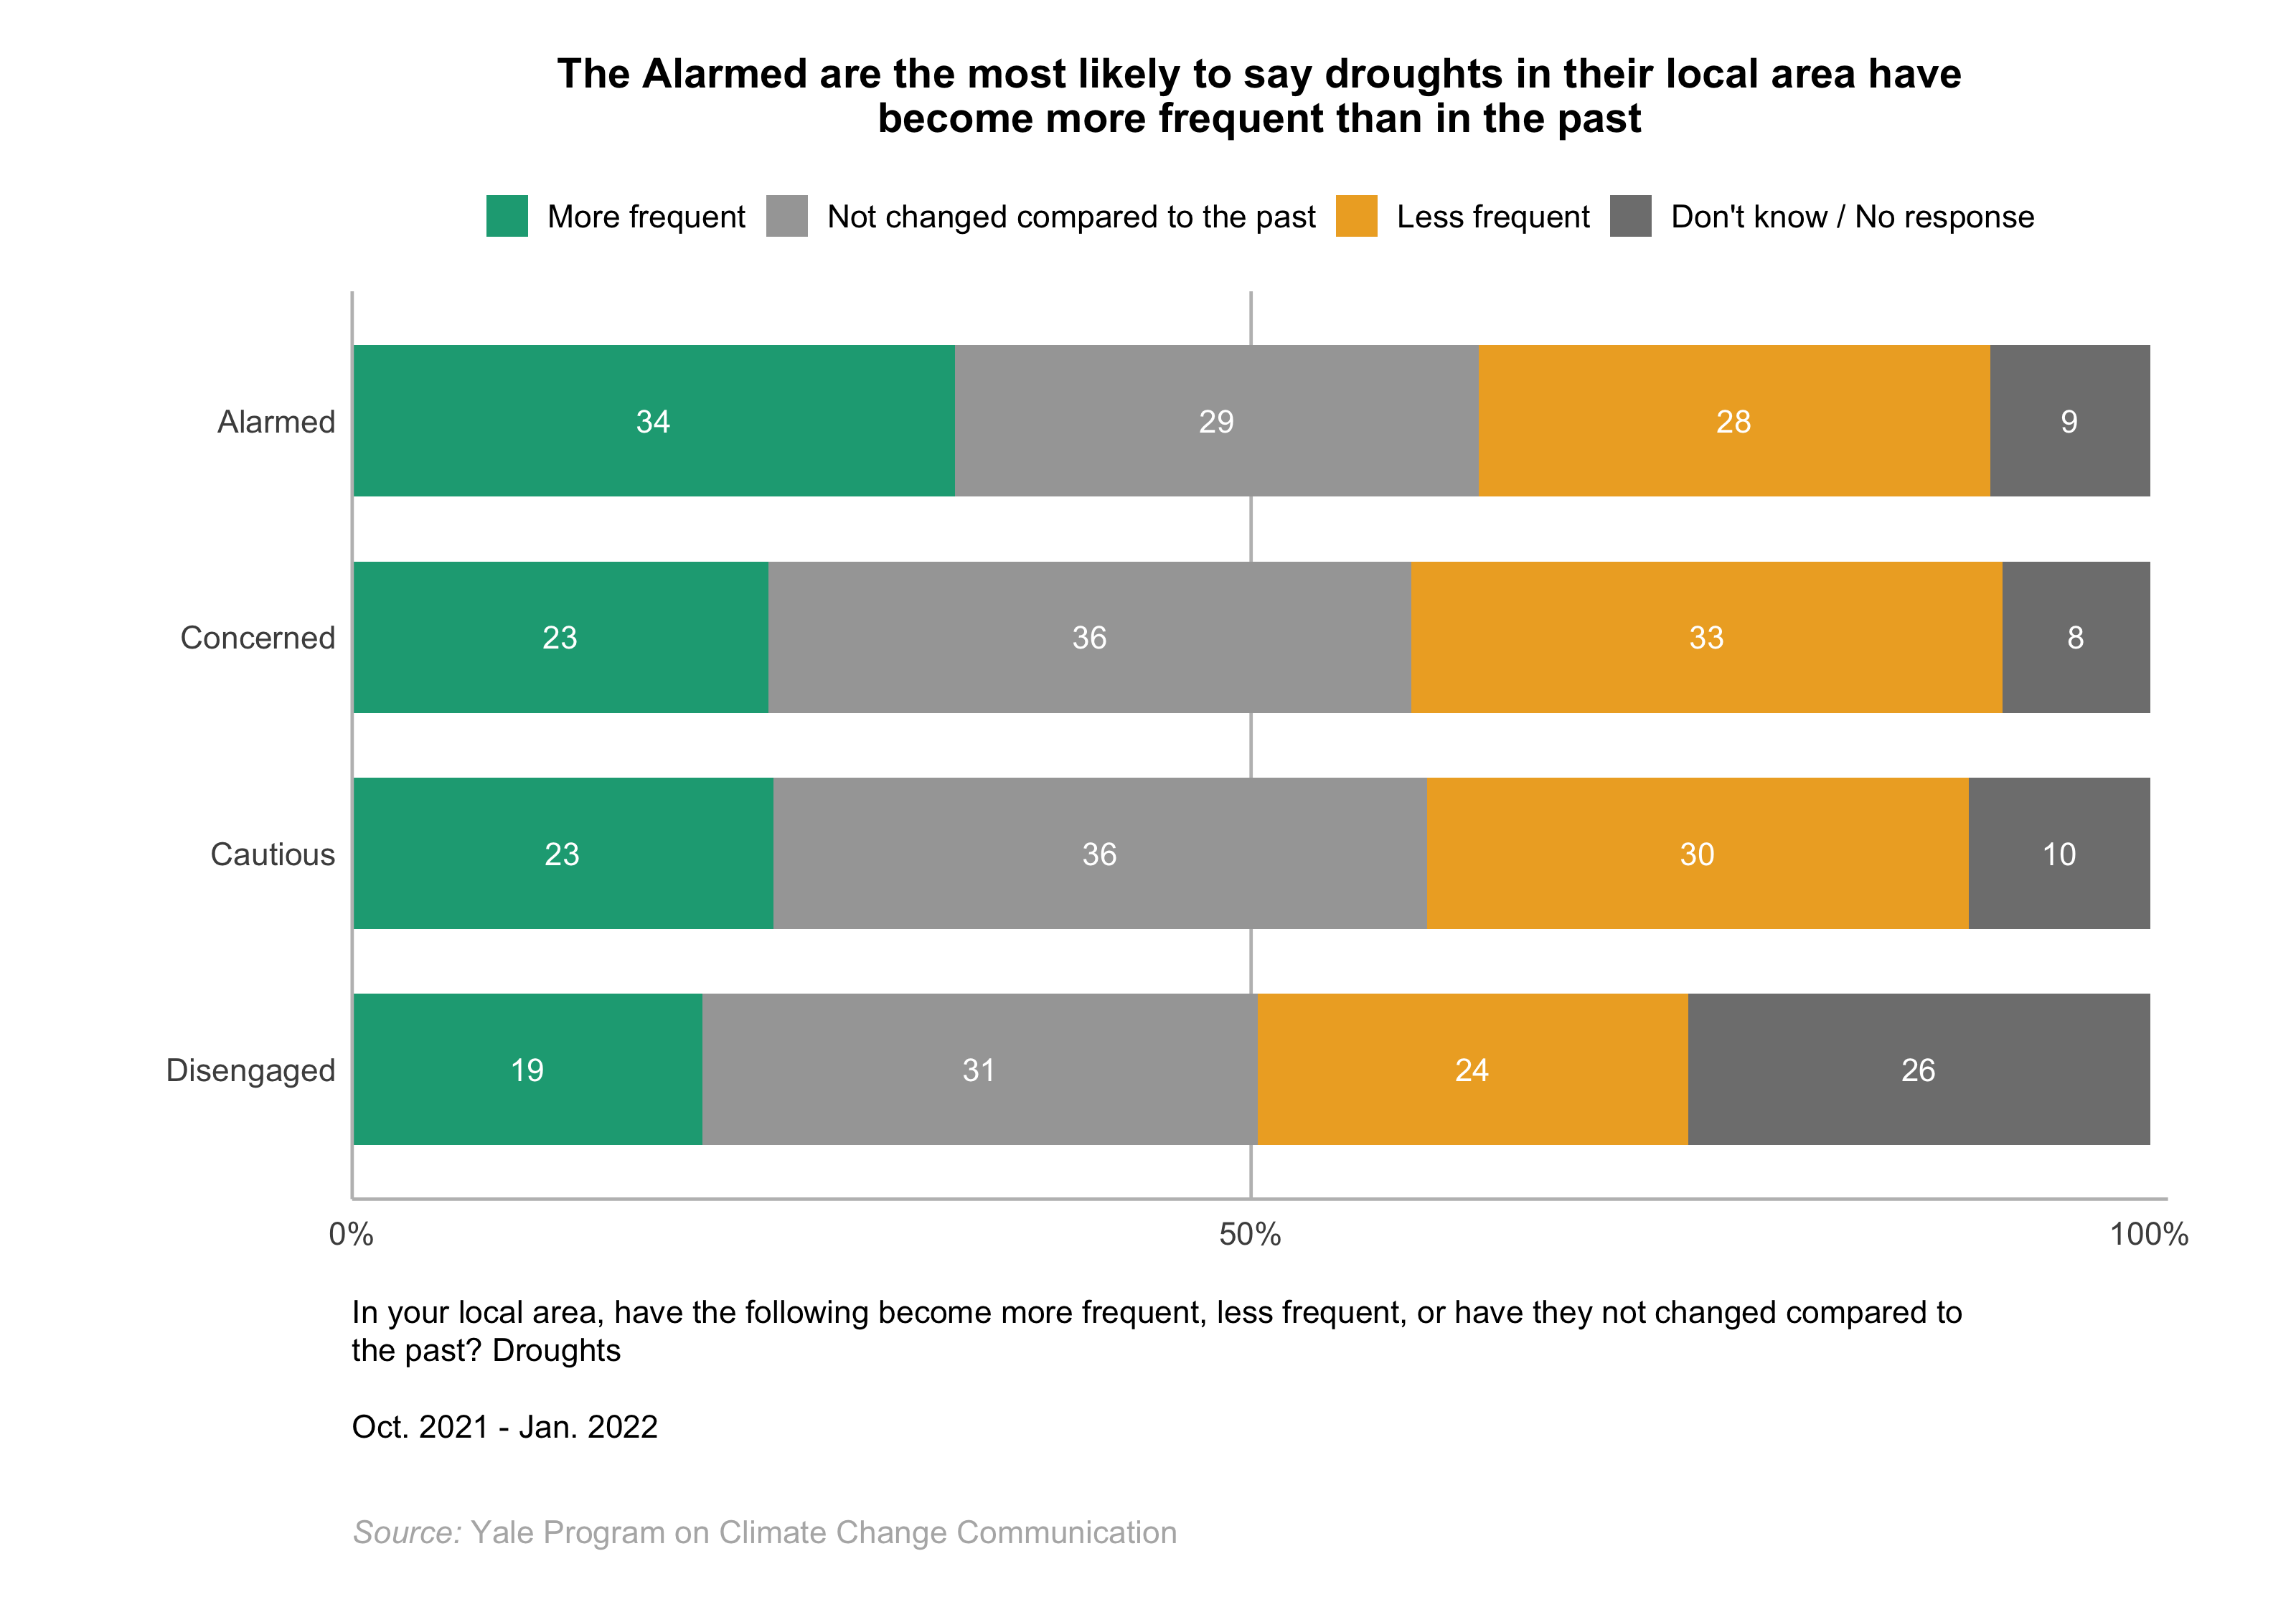
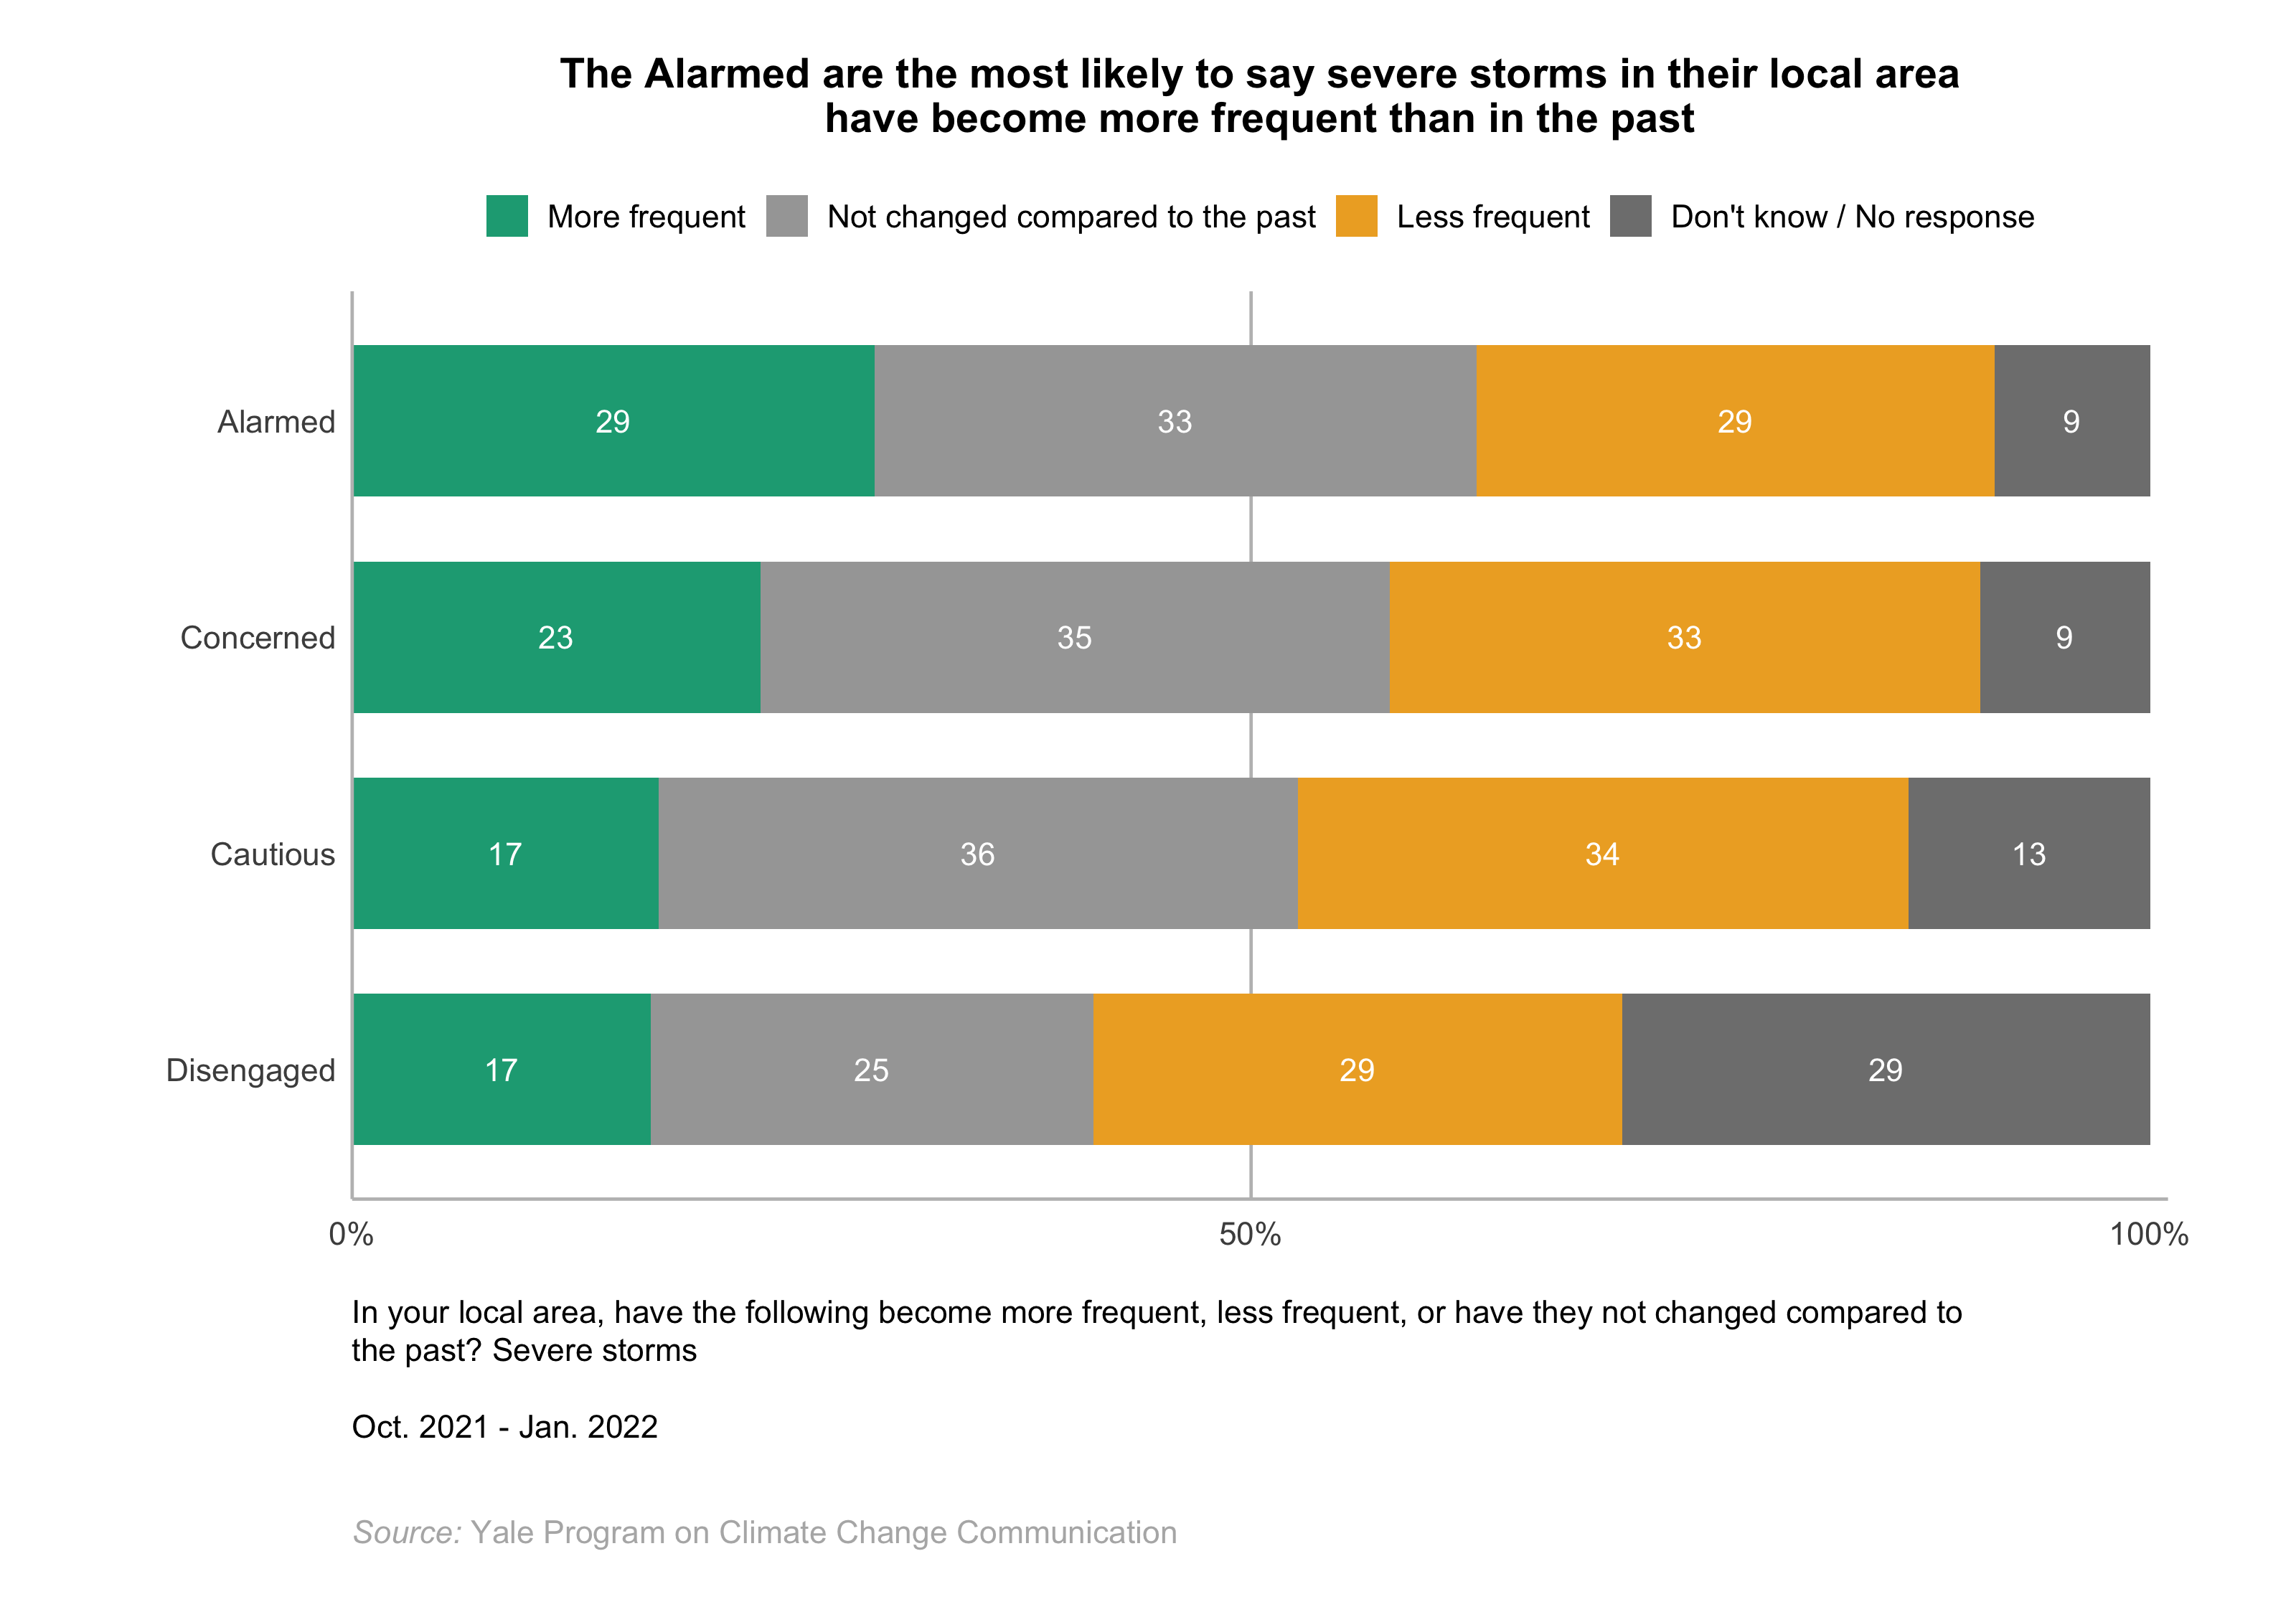
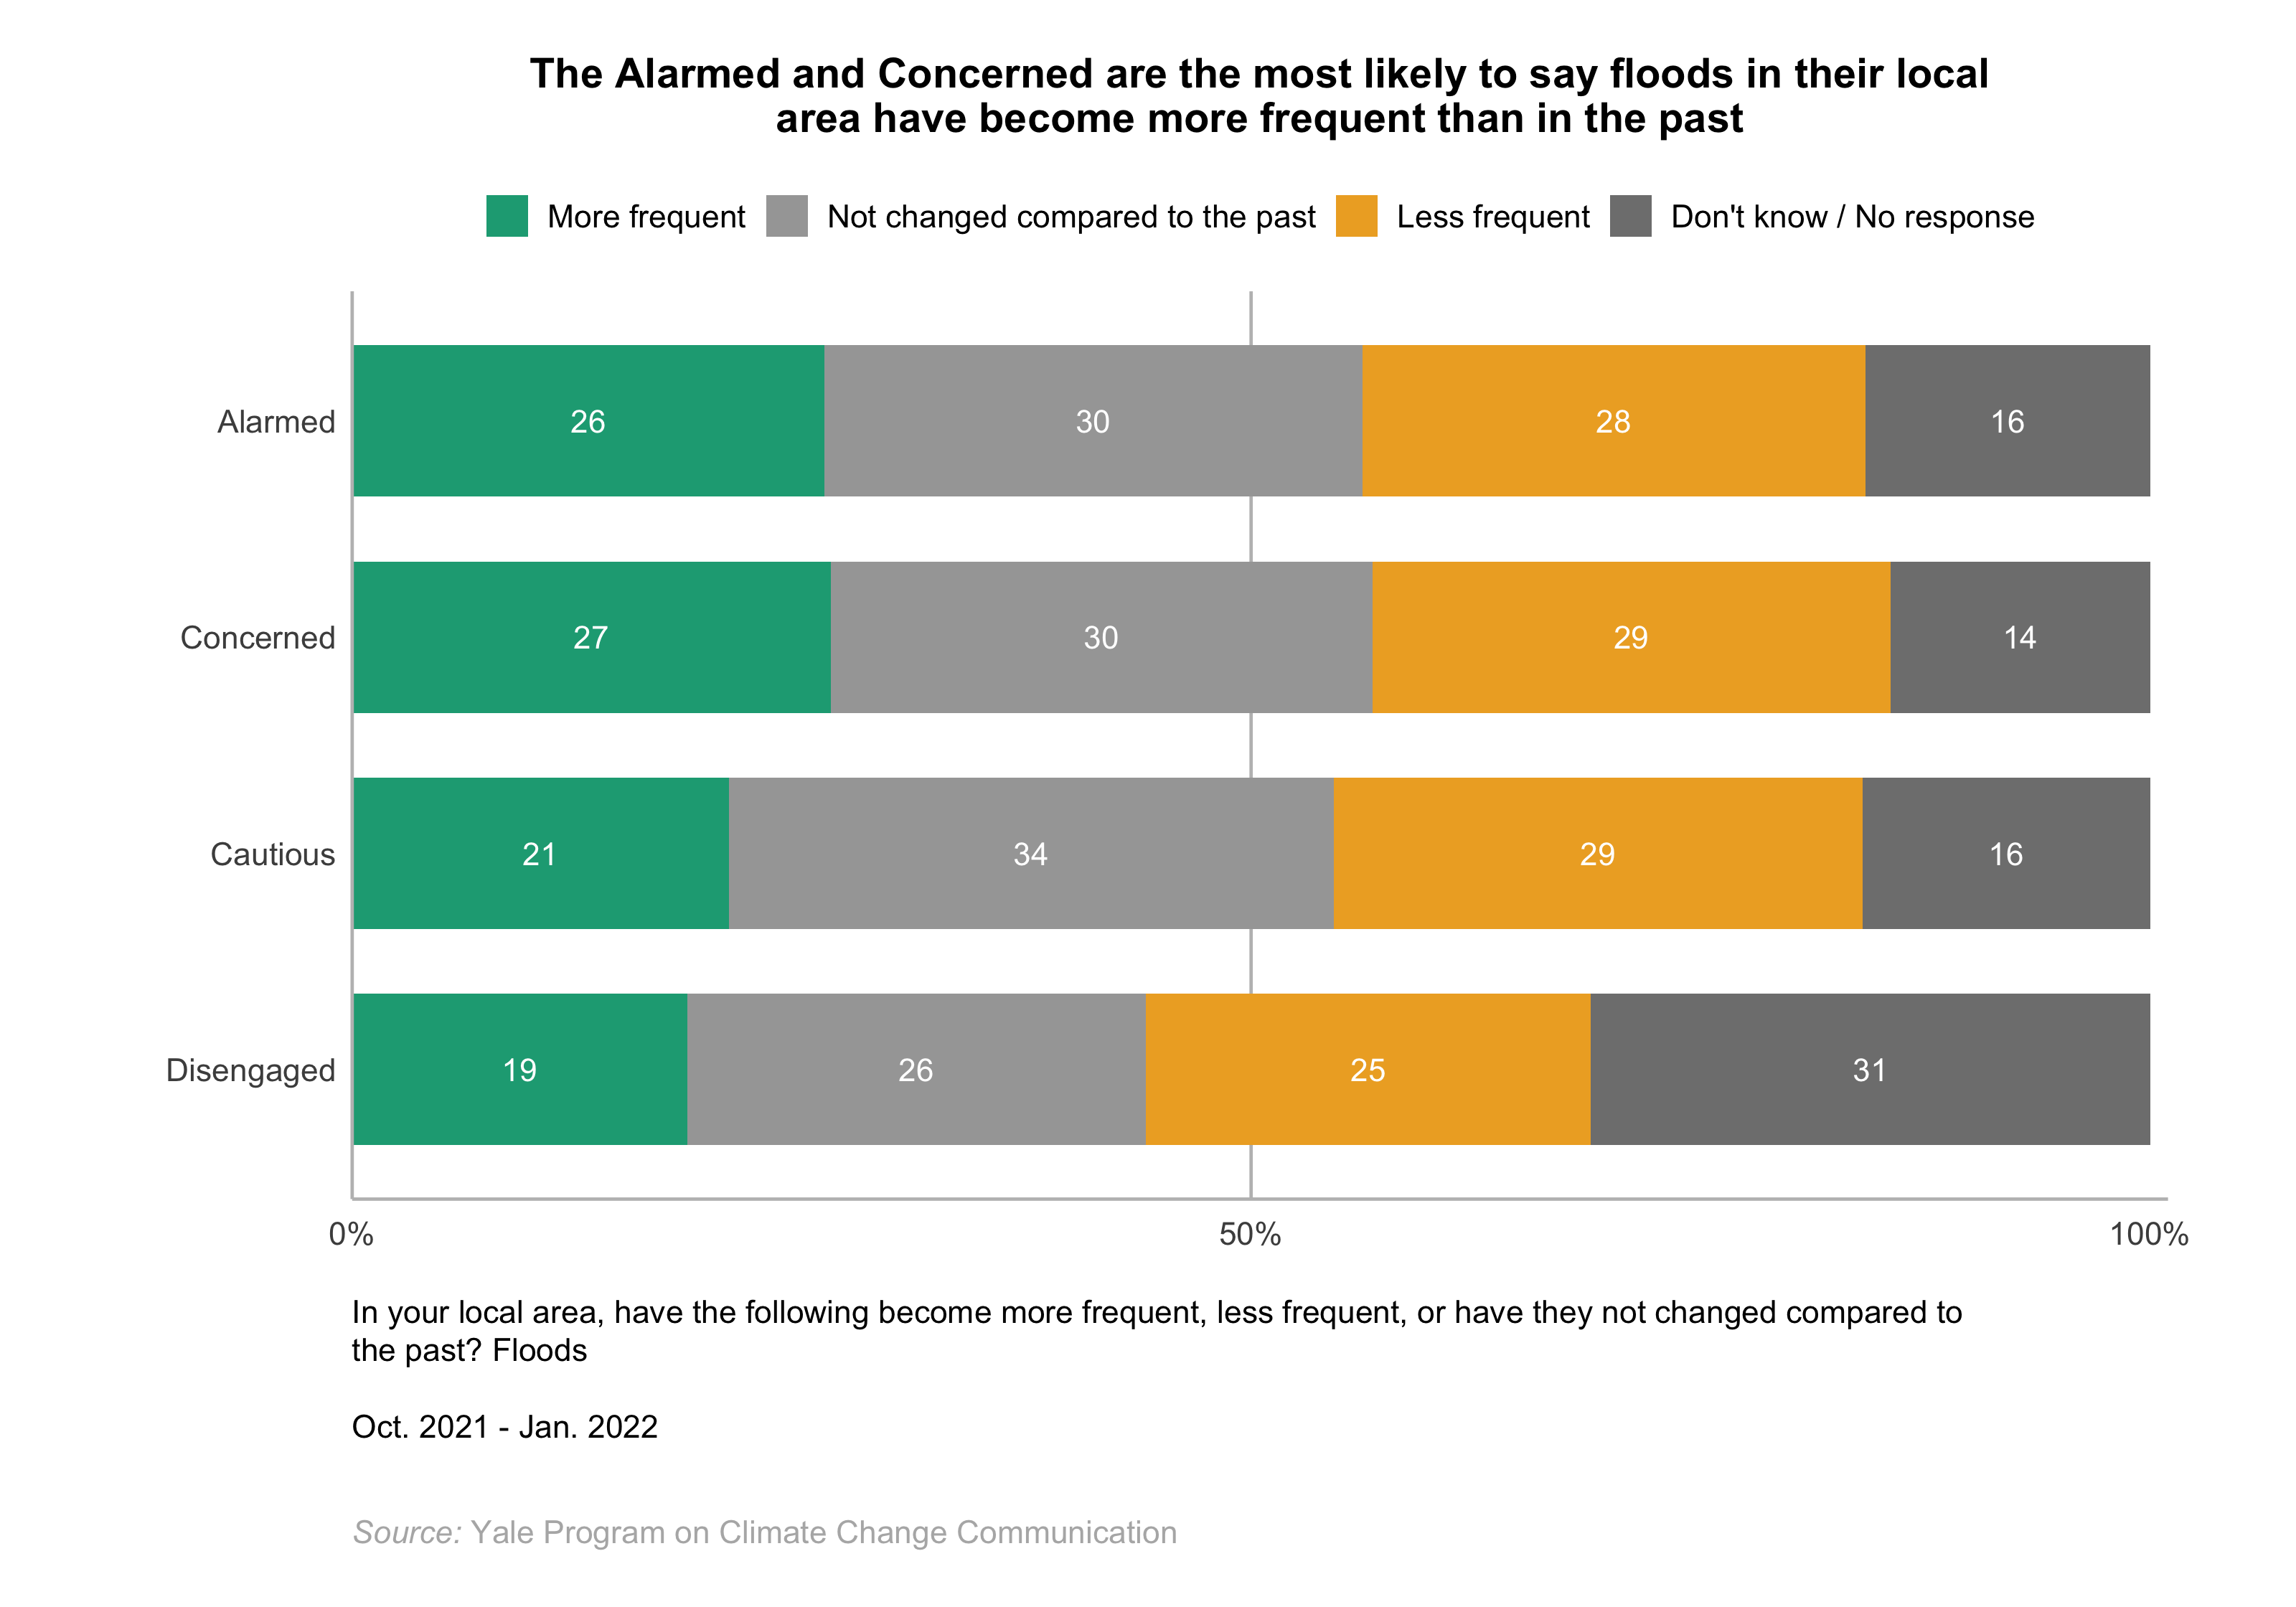
Most people in India have noticed changes in local weather, and the Alarmed have noticed changes to a slightly greater extent than the other segments, particularly the Cautious and Disengaged. More than three-quarters of the Alarmed (78%) say the average amount of rainfall in their local area has changed over the past ten years (increased, 44%; decreased, 34%), while about one in five (21%) say it has stayed about the same. The majority of the Alarmed (73%) have noticed changes in monsoon predictability compared to the past – 28% say the monsoon in their local area has become less predictable, while 46% say it has become more predictable (23% say it has not changed). The Alarmed are also more likely than the other segments to have noticed an increase in hot days (65%), droughts (34%), severe storms (29%), and floods (26%) in their local area compared to the past.
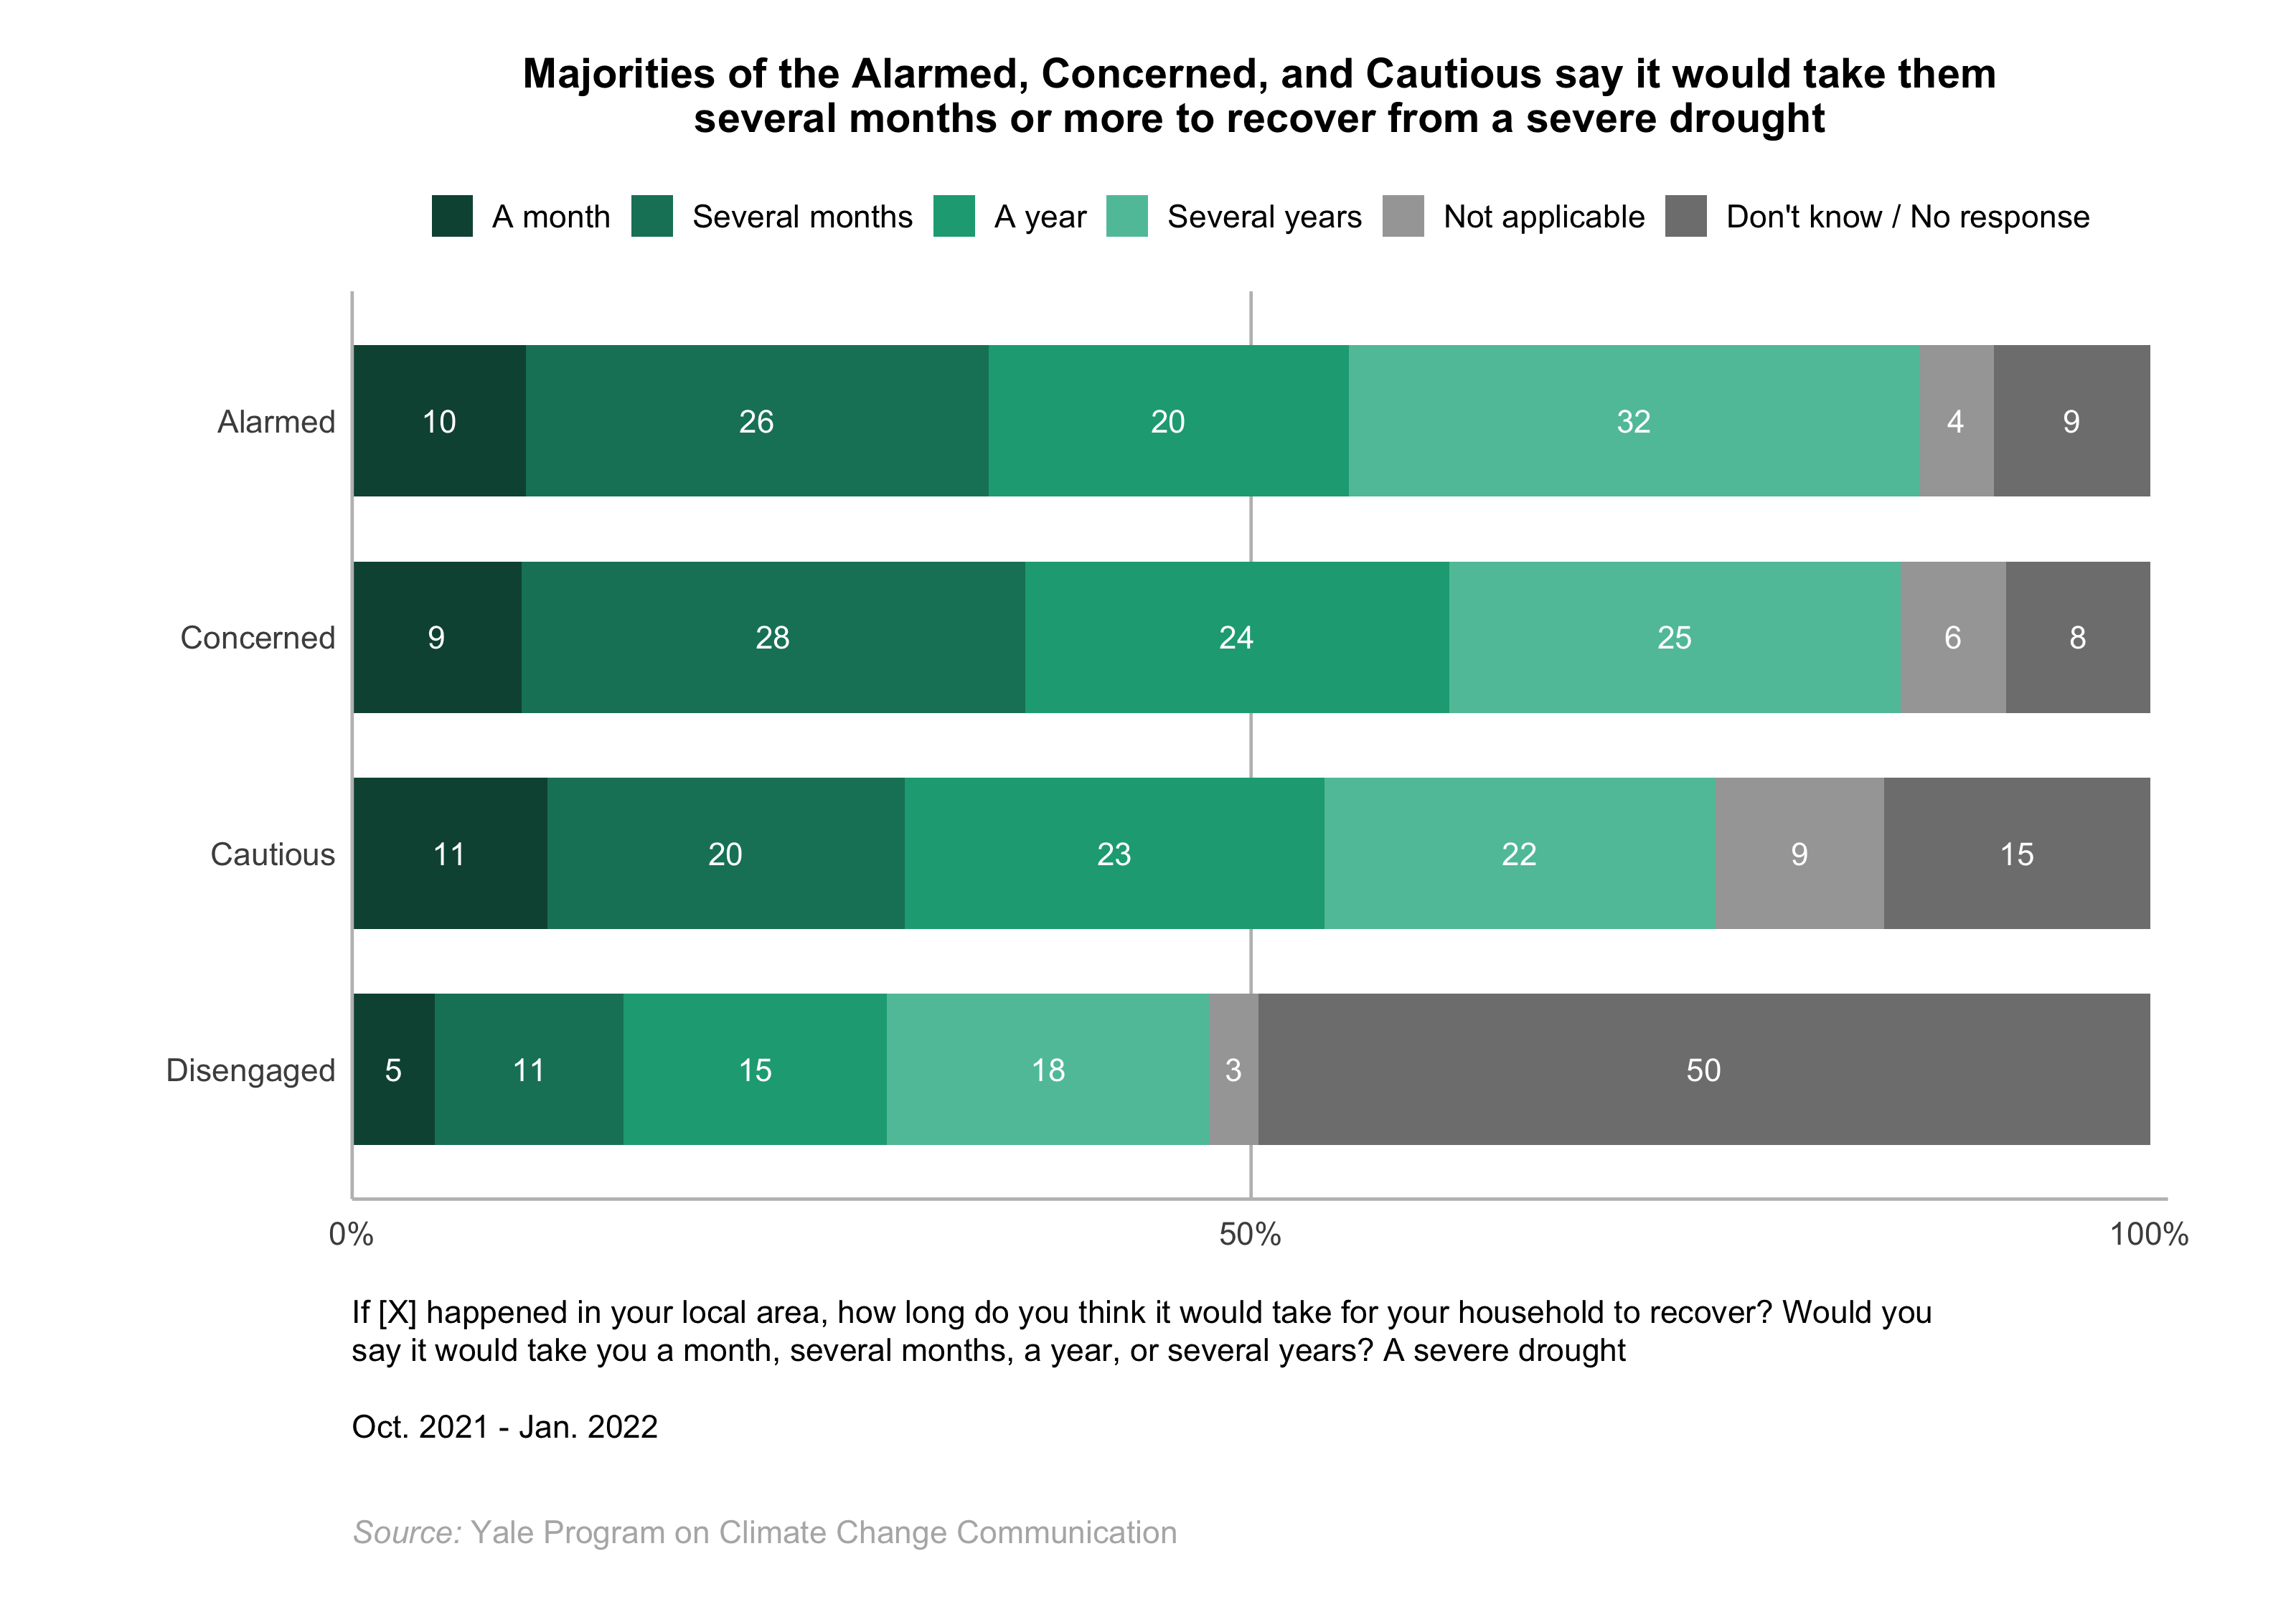
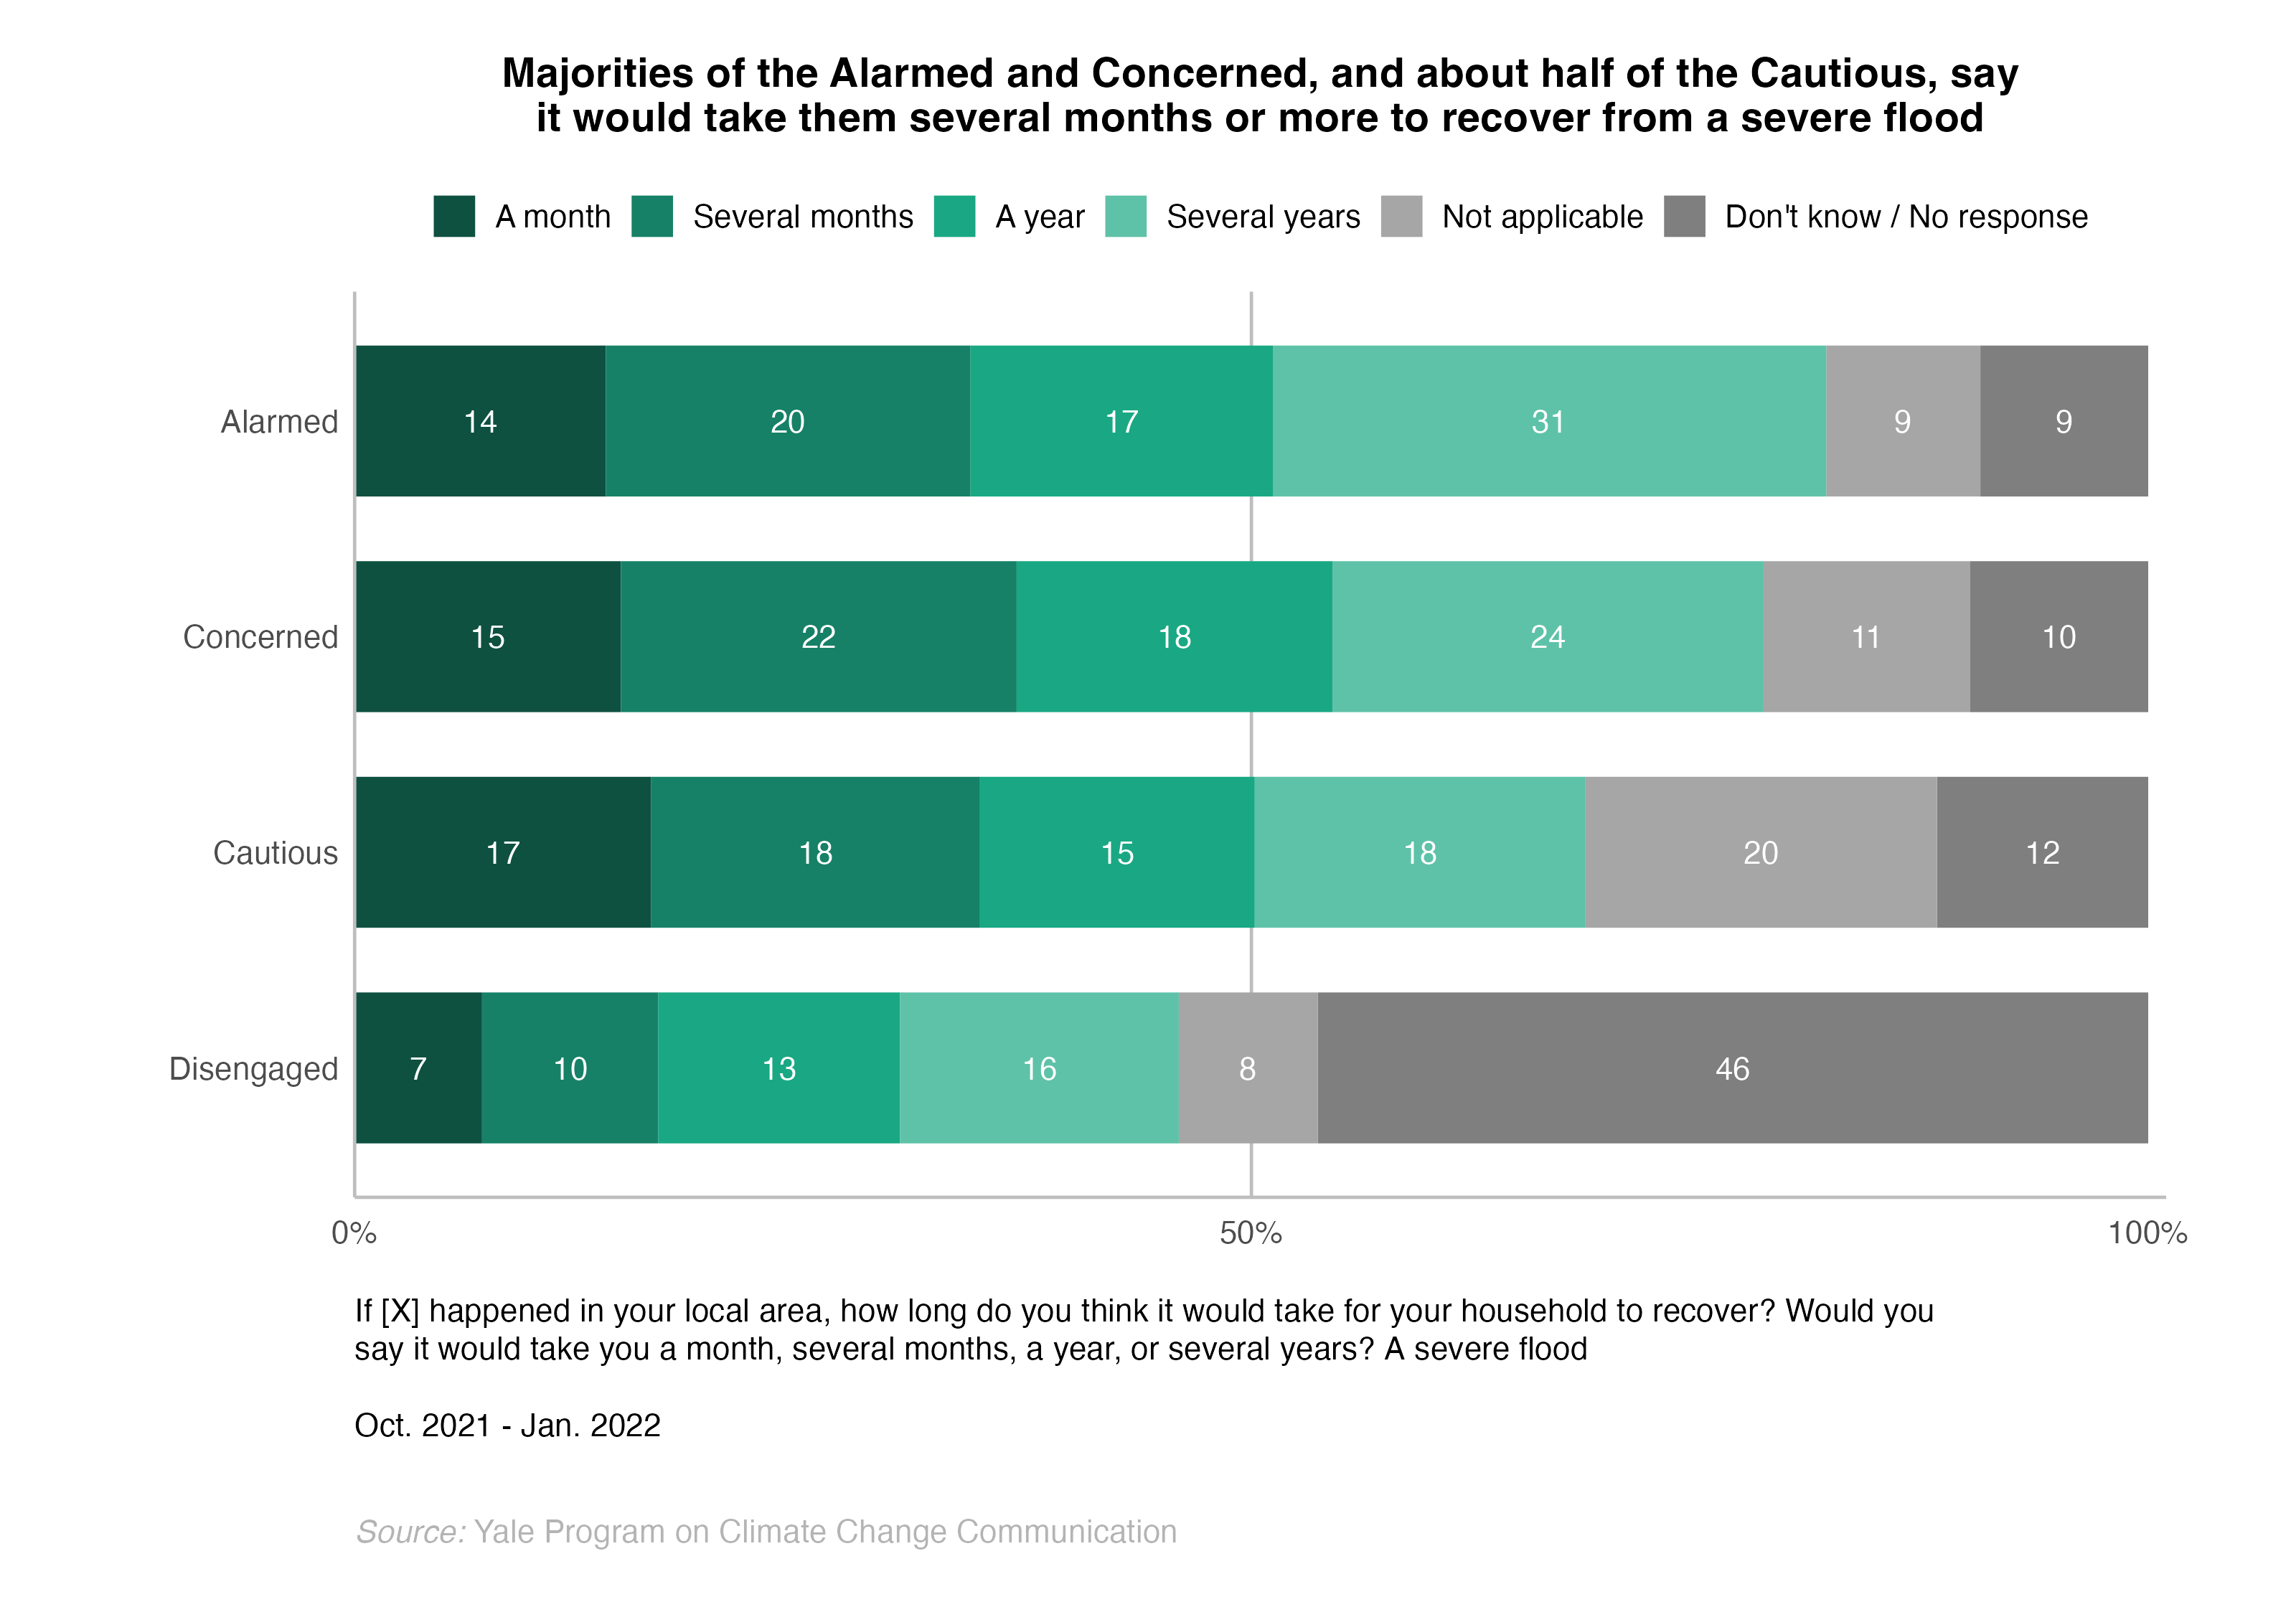
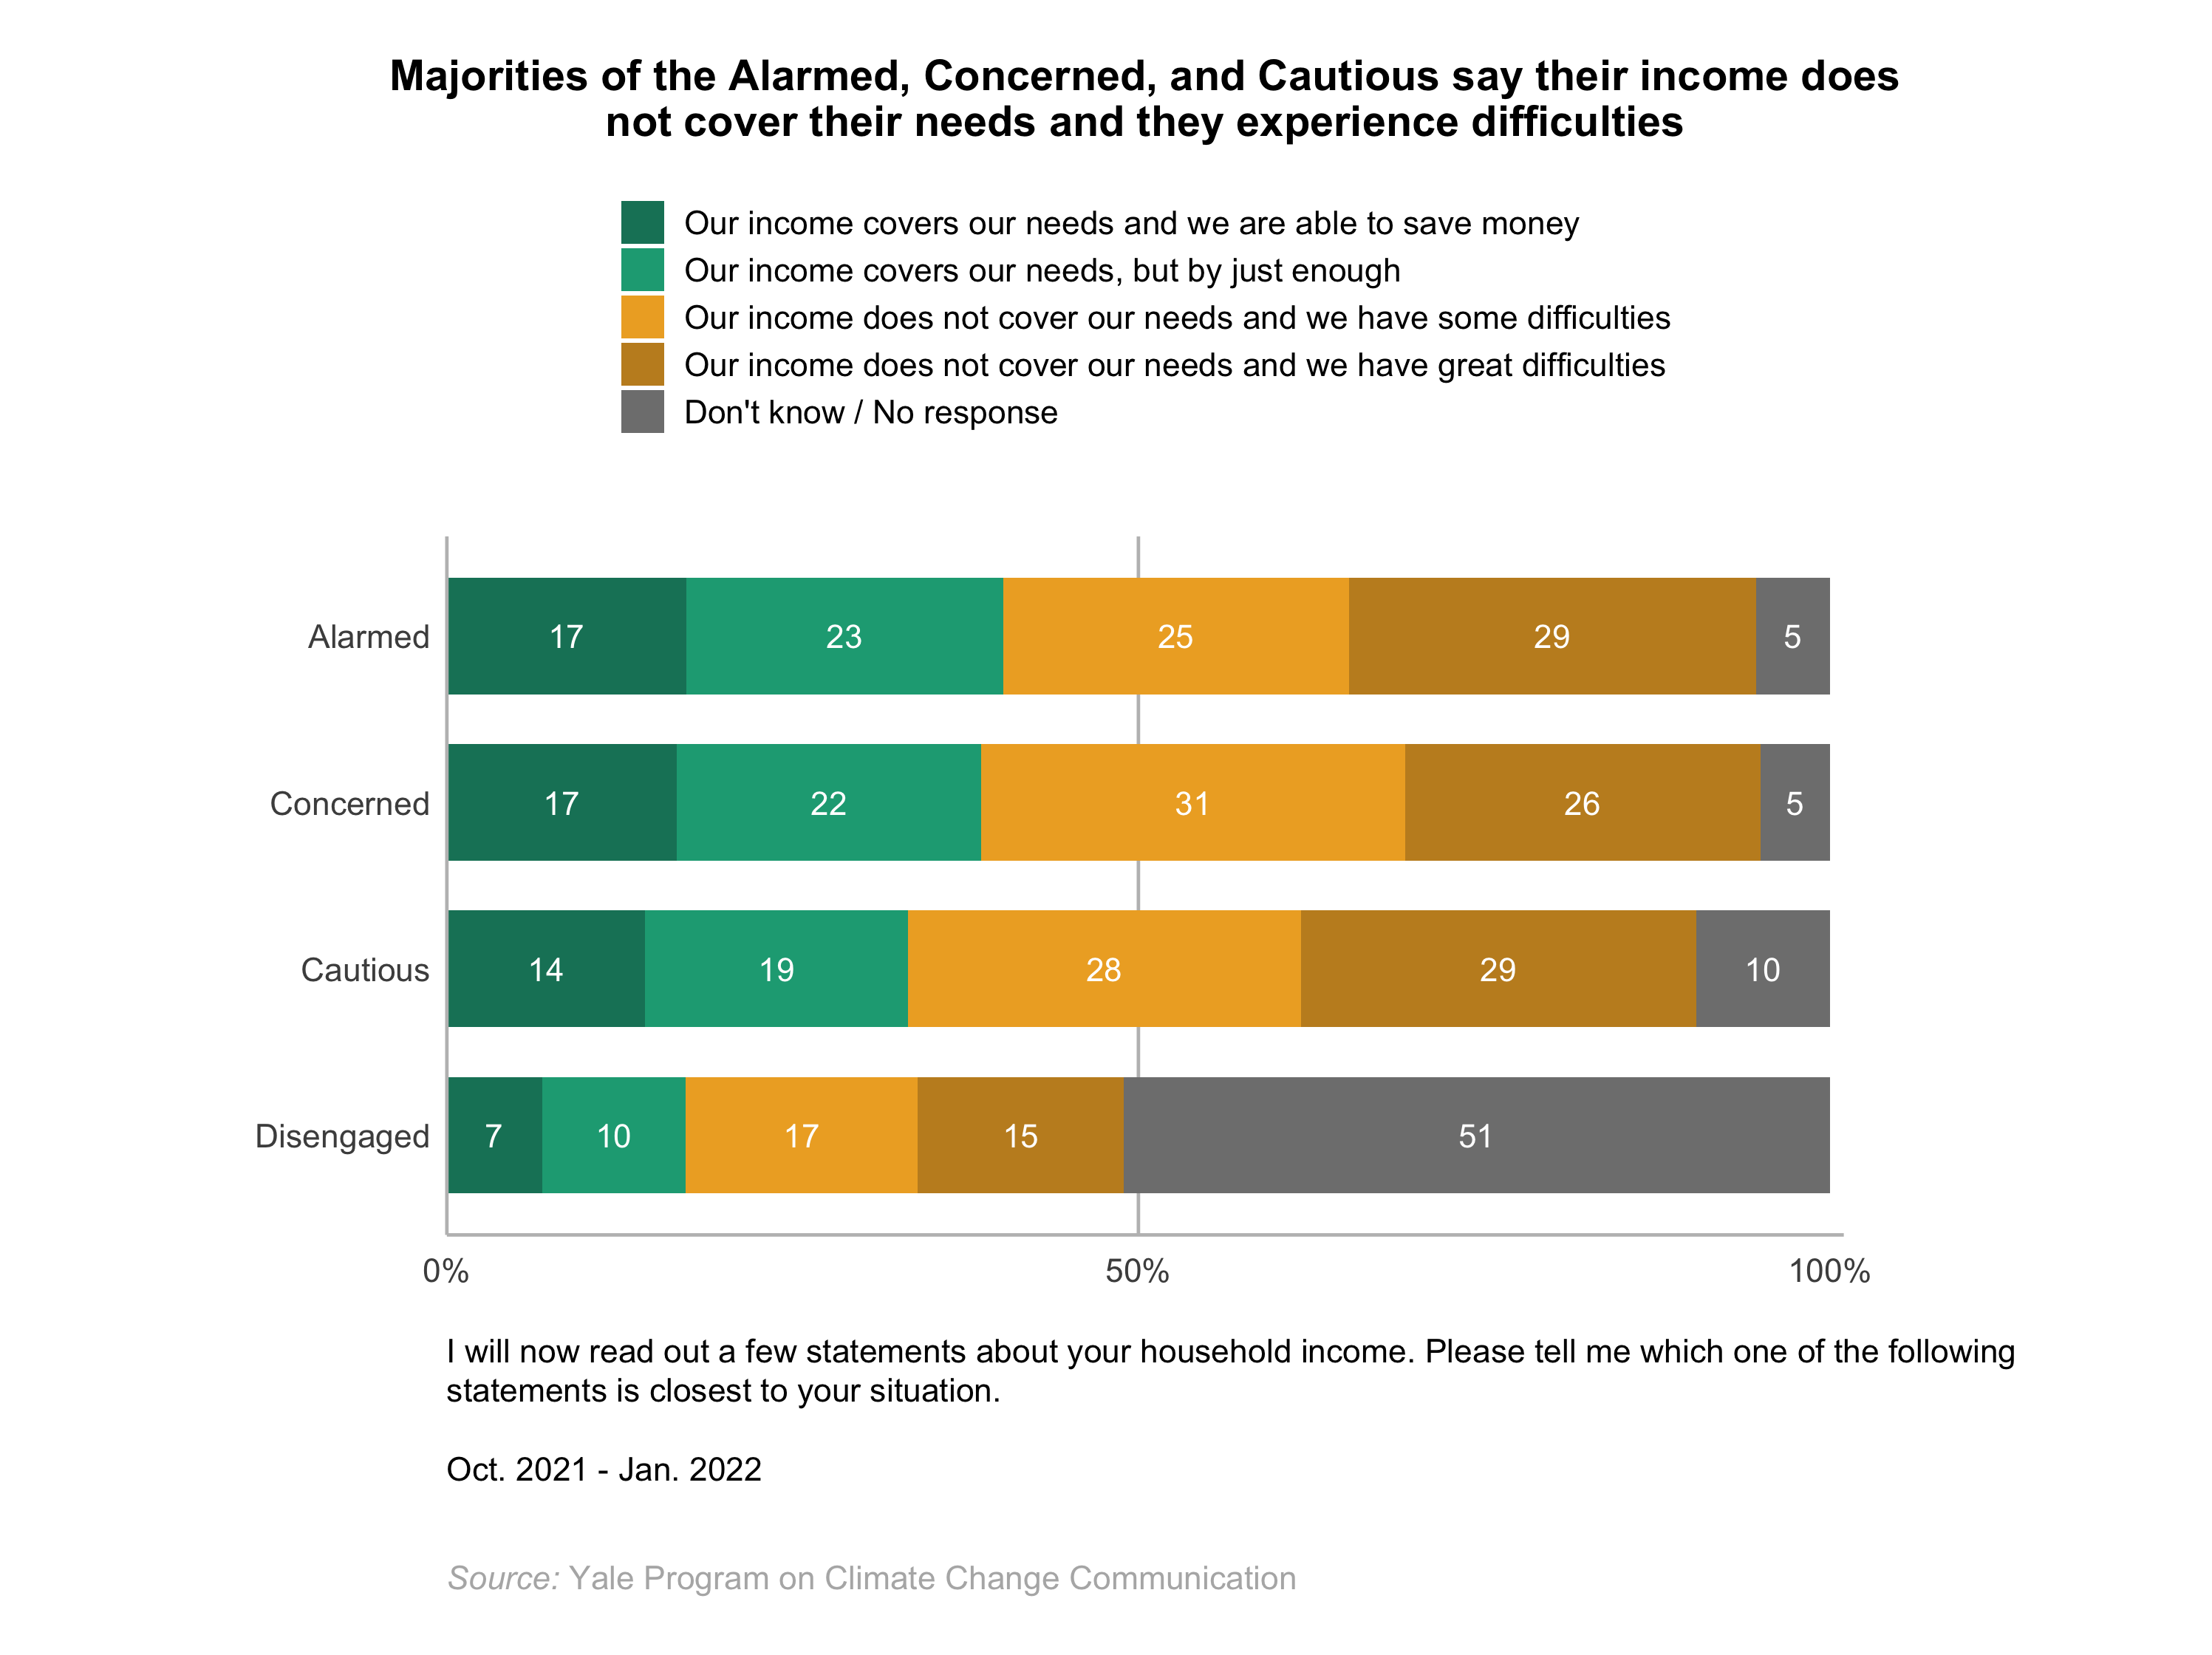
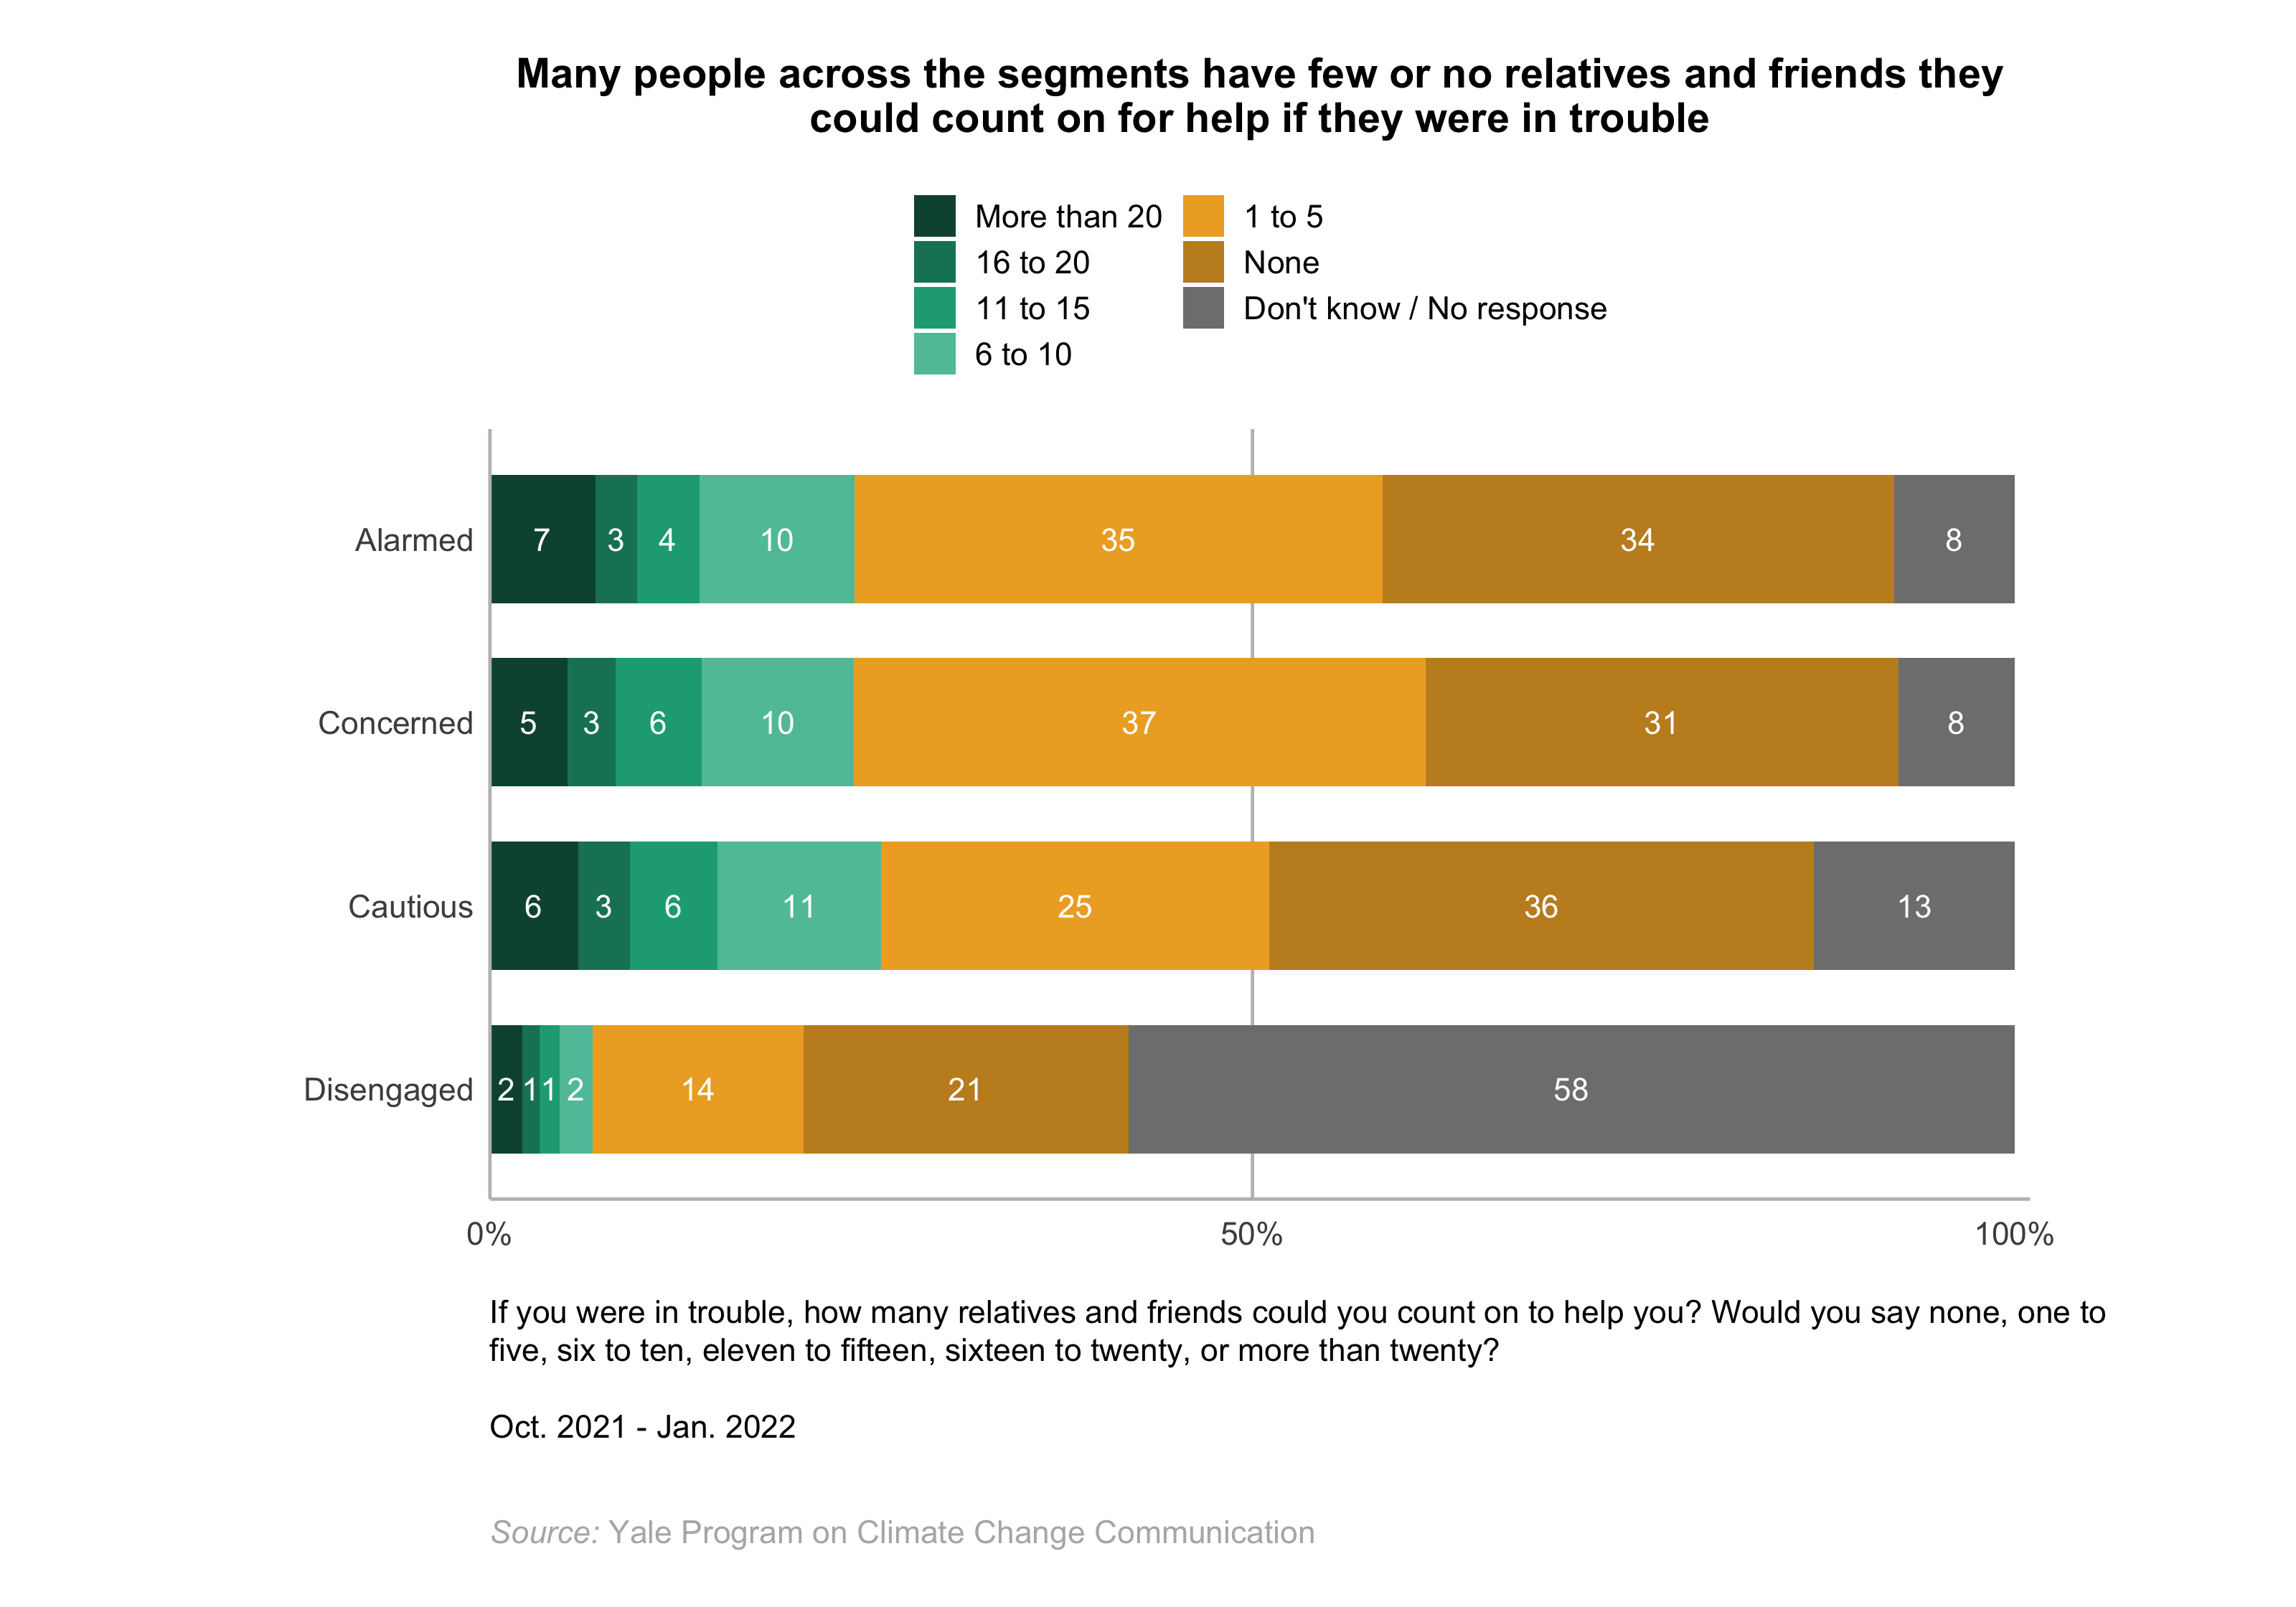
The Alarmed perceive challenges in their capacity to recover from extreme weather events to a greater extent than do the Cautious and Disengaged. Majorities of the Alarmed say it would take their household several months to several years to recover from a severe drought (78%) and/or a severe flood (68%). Additionally, many of the Alarmed say they face financial and social support challenges. Over half of the Alarmed (54%) say their income does not cover their needs, resulting in either “great difficulties” (29%) or “some difficulties” (25%). Furthermore, when asked about how many relatives and friends they could count on if they were in trouble and needed help, most of the Alarmed (68%) say either “1 to 5” (35%) or “none” (34%), while about one in four (24%) say they have at least six or more relatives and friends they could count on.
Concerned
Like the Alarmed, majorities of the Concerned have noticed changes in local weather. About three-quarters of the Concerned (76%) say the average amount of rainfall in their local area has changed over the past 10 years (increased, 50%; decreased, 26%), while 23% say it has stayed about the same. The majority of the Concerned (68%) say the monsoon in their local area has become either less (28%) or more (41%) predictable compared to the past, while 27% say it has not changed. Many of the Concerned have also noticed an increase in extreme local weather events compared to the past, including hot days (48%), floods (27%), droughts (23%), and severe storms (23%).
The Concerned perceive challenges in their capacity to recover from extreme weather events to a greater extent than do the Cautious and Disengaged. Like the Alarmed, majorities of the Concerned say it would take their household several months to several years to recover from a severe drought (77%) and/or a severe flood (64%). Additionally, many of the Concerned say they face financial and social support challenges. Like the Alarmed, the majority of the Concerned (56%) say their income does not cover their needs, resulting in either “great difficulties” (26%) or “some difficulties” (31%). Furthermore, the majority of the Concerned (68%) say they have few relatives and friends they could count on if they were in trouble and needed help (“1 to 5,” 37%; “none,” 31%), while about one in four (24%) say they have at least six or more relatives and friends they could count on for support.
Cautious
Majorities of the Cautious have noticed changes in local weather, but to a lesser extent than the Alarmed and Concerned. Seven in ten of the Cautious (70%) say the average amount of rainfall in their local area has changed over the past 10 years (increased, 48%; decreased, 21%), while 27% say it has stayed about the same. The majority of the Cautious (62%) say they have also noticed changes in monsoon predictability compared to the past – 29% say it has become less predictable, while 33% say the monsoon has become more predictable (33% say it has not changed). Compared to the Alarmed and Concerned, fewer of the Cautious say they have noticed an increase in extreme local weather events compared to the past, including hot days (37%), droughts (23%), floods (21%), and severe storms (17%).
The Cautious perceive challenges in their capacity to recover from extreme weather events, but to a lesser extent than do the Alarmed and Concerned. The majority of the Cautious (65%) say it would take their household several months to several years to recover from a severe drought, and about half (52%) say it would take that long to recover from a severe flood. Like the Alarmed and Concerned, many of the Cautious say they face financial and social support challenges. The majority of the Cautious (57%) say their income does not cover their needs, resulting in either “great difficulties” (29%) or “some difficulties” (28%). Furthermore, the majority of the Cautious (61%) say they have few relatives and friends they could count on if they were in trouble and needed help (“1 to 5,” 25%; “none,” 36%), while about one in four (26%) say they have at least six or more relatives and friends they could count on for support.
Disengaged
The Disengaged are less likely than the other segments to report noticing changes in local weather, and they are more likely to say they don’t know or to not provide a response when asked questions about the weather and potential challenges they may experience (ranging from 12% to 58% across questions). However, more of the Disengaged express an opinion about these questions than most of the other questions in the survey. The majority of the Disengaged (65%) say the average amount of rainfall in their local area has changed over the past 10 years (increased, 38%; decreased, 26%), while 23% say it has stayed about the same. Fewer (41%) have noticed changes in monsoon predictability compared to the past, including 16% who say the monsoon in their local area has become less predictable and 25% who say it has become more predictable (27% say it has not changed). Similar to the Cautious, the Disengaged are less likely than the Alarmed and Concerned to have noticed an increase in extreme local weather events compared to the past, including hot days (37%), droughts (19%), floods (19%), and severe storms (17%).
Many of the Disengaged perceive challenges in their capacity to recover from extreme weather events, but to a lesser extent than the other segments. About four in ten Disengaged say it would take their household several months to several years to recover from a severe drought (43%), and/or a severe flood (39%). About one in three of the Disengaged (32%) say their income does not cover their needs, resulting in either “great difficulties” (15%) or “some difficulties” (17%). When asked about how many relatives and friends they could count on if they were in trouble and needed help, 35% say they either have “1 to 5” (14%) or “none” (21%), while only 7% say they have at least six or more.