Report · May 4, 2023
Global Warming’s Four Indias, 2022: An Audience Segmentation Analysis
By Anthony Leiserowitz, Jagadish Thaker, Matthew Goldberg, Matthew Ballew, Seth Rosenthal, Jennifer Carman, Liz Neyens, Sanguk Lee, Yashwant Deshmukh, Gaura Shukla and Jennifer Marlon
Filed under: Beliefs & Attitudes, Policy & Politics, Behaviors & Actions and Audiences
Appendix: Methods
This report is based on findings from a nationally representative survey of adults (18+) in India conducted by the Yale Program on Climate Change Communication and CVoter, an international survey company headquartered in Delhi, India. A nationally representative sample of respondents was contacted by mobile telephone using predictive dialing technology and computer-assisted telephone interviewing (CATI). The survey was translated into 12 languages (Hindi, Punjabi, Gujarati, Marathi, Kannada, Malayalam, Tamil, Telugu, Odiya, Bangla, Asamiya, and English) and respondents received the survey in one of those languages based on their geographic location in India. National Census-based demographic parameters were used to create sampling targets for gender, education, and socioeconomic status. The results were also weighted after the data collection was completed to adjust the final sample to match national demographic parameters on gender, age, education, income, religion, and urbanicity. Interview dates: October 21, 2021 – January 9, 2022. Interviews: 4,619 adults (18+). Average margin of error at the 95% confidence level is +/- 1.4 percentage points for the full sample. Margins of error for the four audience segments are: Alarmed +/- 1.9 percentage points (n = 2,545); Concerned +/- 2.7 percentage points (n = 1,271); Cautious +/- 4.6 percentage points (n = 454); and Disengaged +/- 5.2 percentage points (n = 349).
In the charts/figures, percentages are weighted to match national population parameters. For tabulation purposes, percentage points are rounded to the nearest whole number. As a result, percentages in a given chart may total slightly higher or lower than 100%. Summed response categories (e.g., “strongly agree” + “somewhat agree”) are rounded after sums are calculated. For example, in some cases, the sum of 25% + 25% might be reported as 51% (e.g., 25.3% + 25.3% = 50.6%, which, after rounding, would be reported as 25% + 25% = 51%).
The survey instrument was designed by Anthony Leiserowitz, Seth Rosenthal, Jennifer Carman, Jennifer Marlon, and Arunima Sircar of Yale University, Jagadish Thaker of the University of Queensland, and Yashwant Deshmukh and Guara Shukla of CVoter. This report was written by Matthew Ballew, Seth Rosenthal, and Anthony Leiserowitz of Yale University, and Jagadish Thaker of the University of Queensland. The segmentation was developed by Matthew Goldberg and other data analyses were conducted by Matthew Ballew. Charts/figures in the report were created by Matthew Ballew and Sanguk Lee of Yale University, as well as Russell Shaddox and Liz Neyens.
Audience Segmentation Analysis
The approach to this work is based on the established methodology of the Global Warming’s Six Americas project conducted by the Yale Program on Climate Change Communication and the George Mason University Center for Climate Change Communication. Latent class analysis (LCA) was conducted on a subset of Climate Change in the Indian Mind, 2022 survey questions to identify distinct audiences in the population based on similar patterns of responses to questions about climate change. LCA works by analyzing how different types of people can be clustered into smaller audiences or “classes” based on their pattern of responses. The analysis then balances the accuracy of segmentation with the practicality of the audience sizes for reporting and strategic purposes. This process led to the development of the four distinct audience segments in the Indian population.
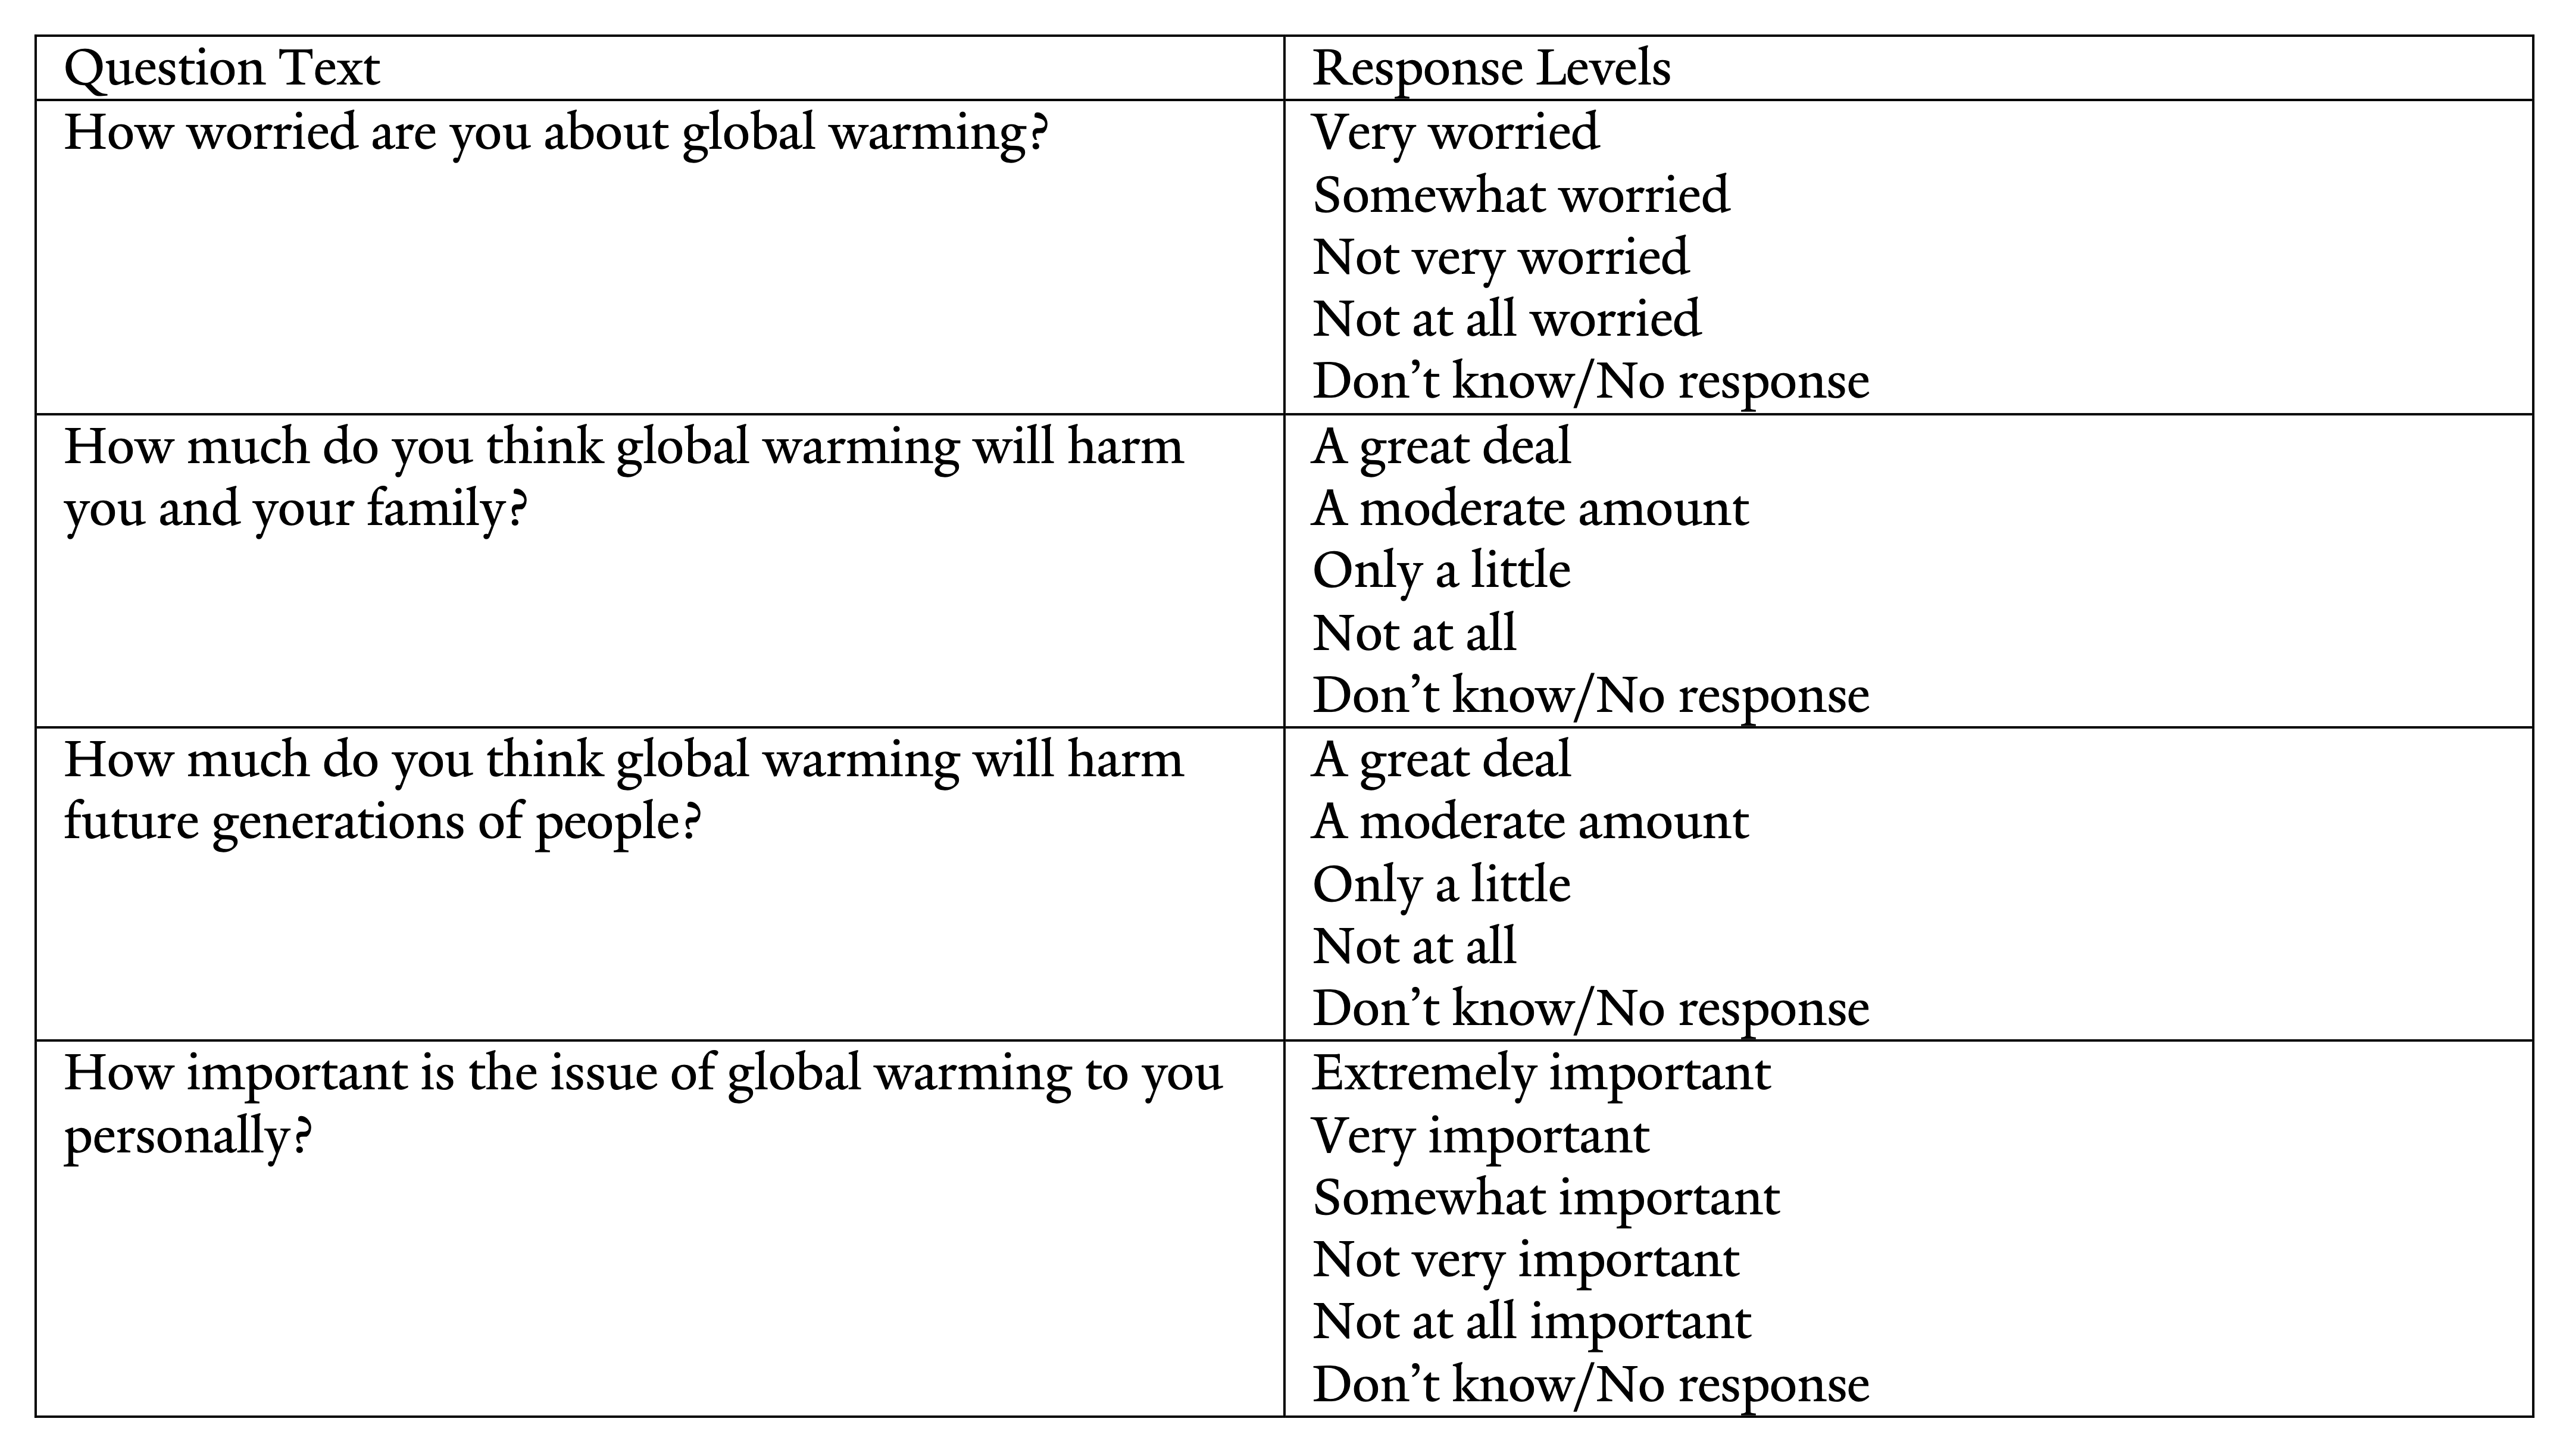
The segmentation analyses incorporated information from 4 variablesInitially, 23 variables were explored as input for the audience segmentation analysis. Through iterative testing and interpretation, the 4 variables that provided the most parsimonious and interpretable segments were selected for the solution used in this report. Segmentation analyses that use additional or different variables will likely yield different results. Additionally, these 4 variables are similar to the variables used in the Six Americas Super Short Survey (SASSY). Even though the India and U.S. segmentations rely on similar variables, they produce different results (i.e., four segments in India versus six segments in the United States). This may reflect differences between the two countries in the distribution of climate opinion and/or differences in question wording and interpretation across surveys. (listed in the table below) and was conducted using the poLCA package in R. The package uses LCA to identify clusters of respondents who are similar to one another on the measured variables, and was chosen because it works with categorical data. The model aims to identify unobserved “latent classes” (i.e., segments) that help explain the relationships between the measured variables. The analysis used the expectation-maximization (EM) and Newton-Raphson algorithms to maximize the log-likelihood function of belonging to each group. Thus, each person is assigned a probability of belonging to each potential cluster. The model begins with random values and proceeds iteratively, replacing old values with new values in each iteration until the maximum likelihood is reached. Put simply, respondents with similar responses on the observed variables will cluster into the same segments, with each response evaluated as to whether it causes a given respondent to have a lower or higher likelihood of being assigned to a given segment.
The segmentation analyses generated several potential solutions ranging from 3-segments to 10-segments. Model fit statistics (Akaike Information Criterion and Bayesian Information Criterion) were used to guide the assessment of each potential solution and evaluate the trade-off between parsimony (fewer segments) and the informational value of each additional segment. Additionally, the interpretability of each solution was assessed by examining cross-tabulations of each segment with other variables in the dataset. The 4-segment solution was selected as the most interpretable and useful. It is the solution presented in this report.