Report · May 4, 2023
Global Warming’s Four Indias, 2022: An Audience Segmentation Analysis
By Anthony Leiserowitz, Jagadish Thaker, Matthew Goldberg, Matthew Ballew, Seth Rosenthal, Jennifer Carman, Liz Neyens, Sanguk Lee, Yashwant Deshmukh, Gaura Shukla and Jennifer Marlon
Filed under: Beliefs & Attitudes, Policy & Politics, Behaviors & Actions and Audiences
8. Household Characteristics
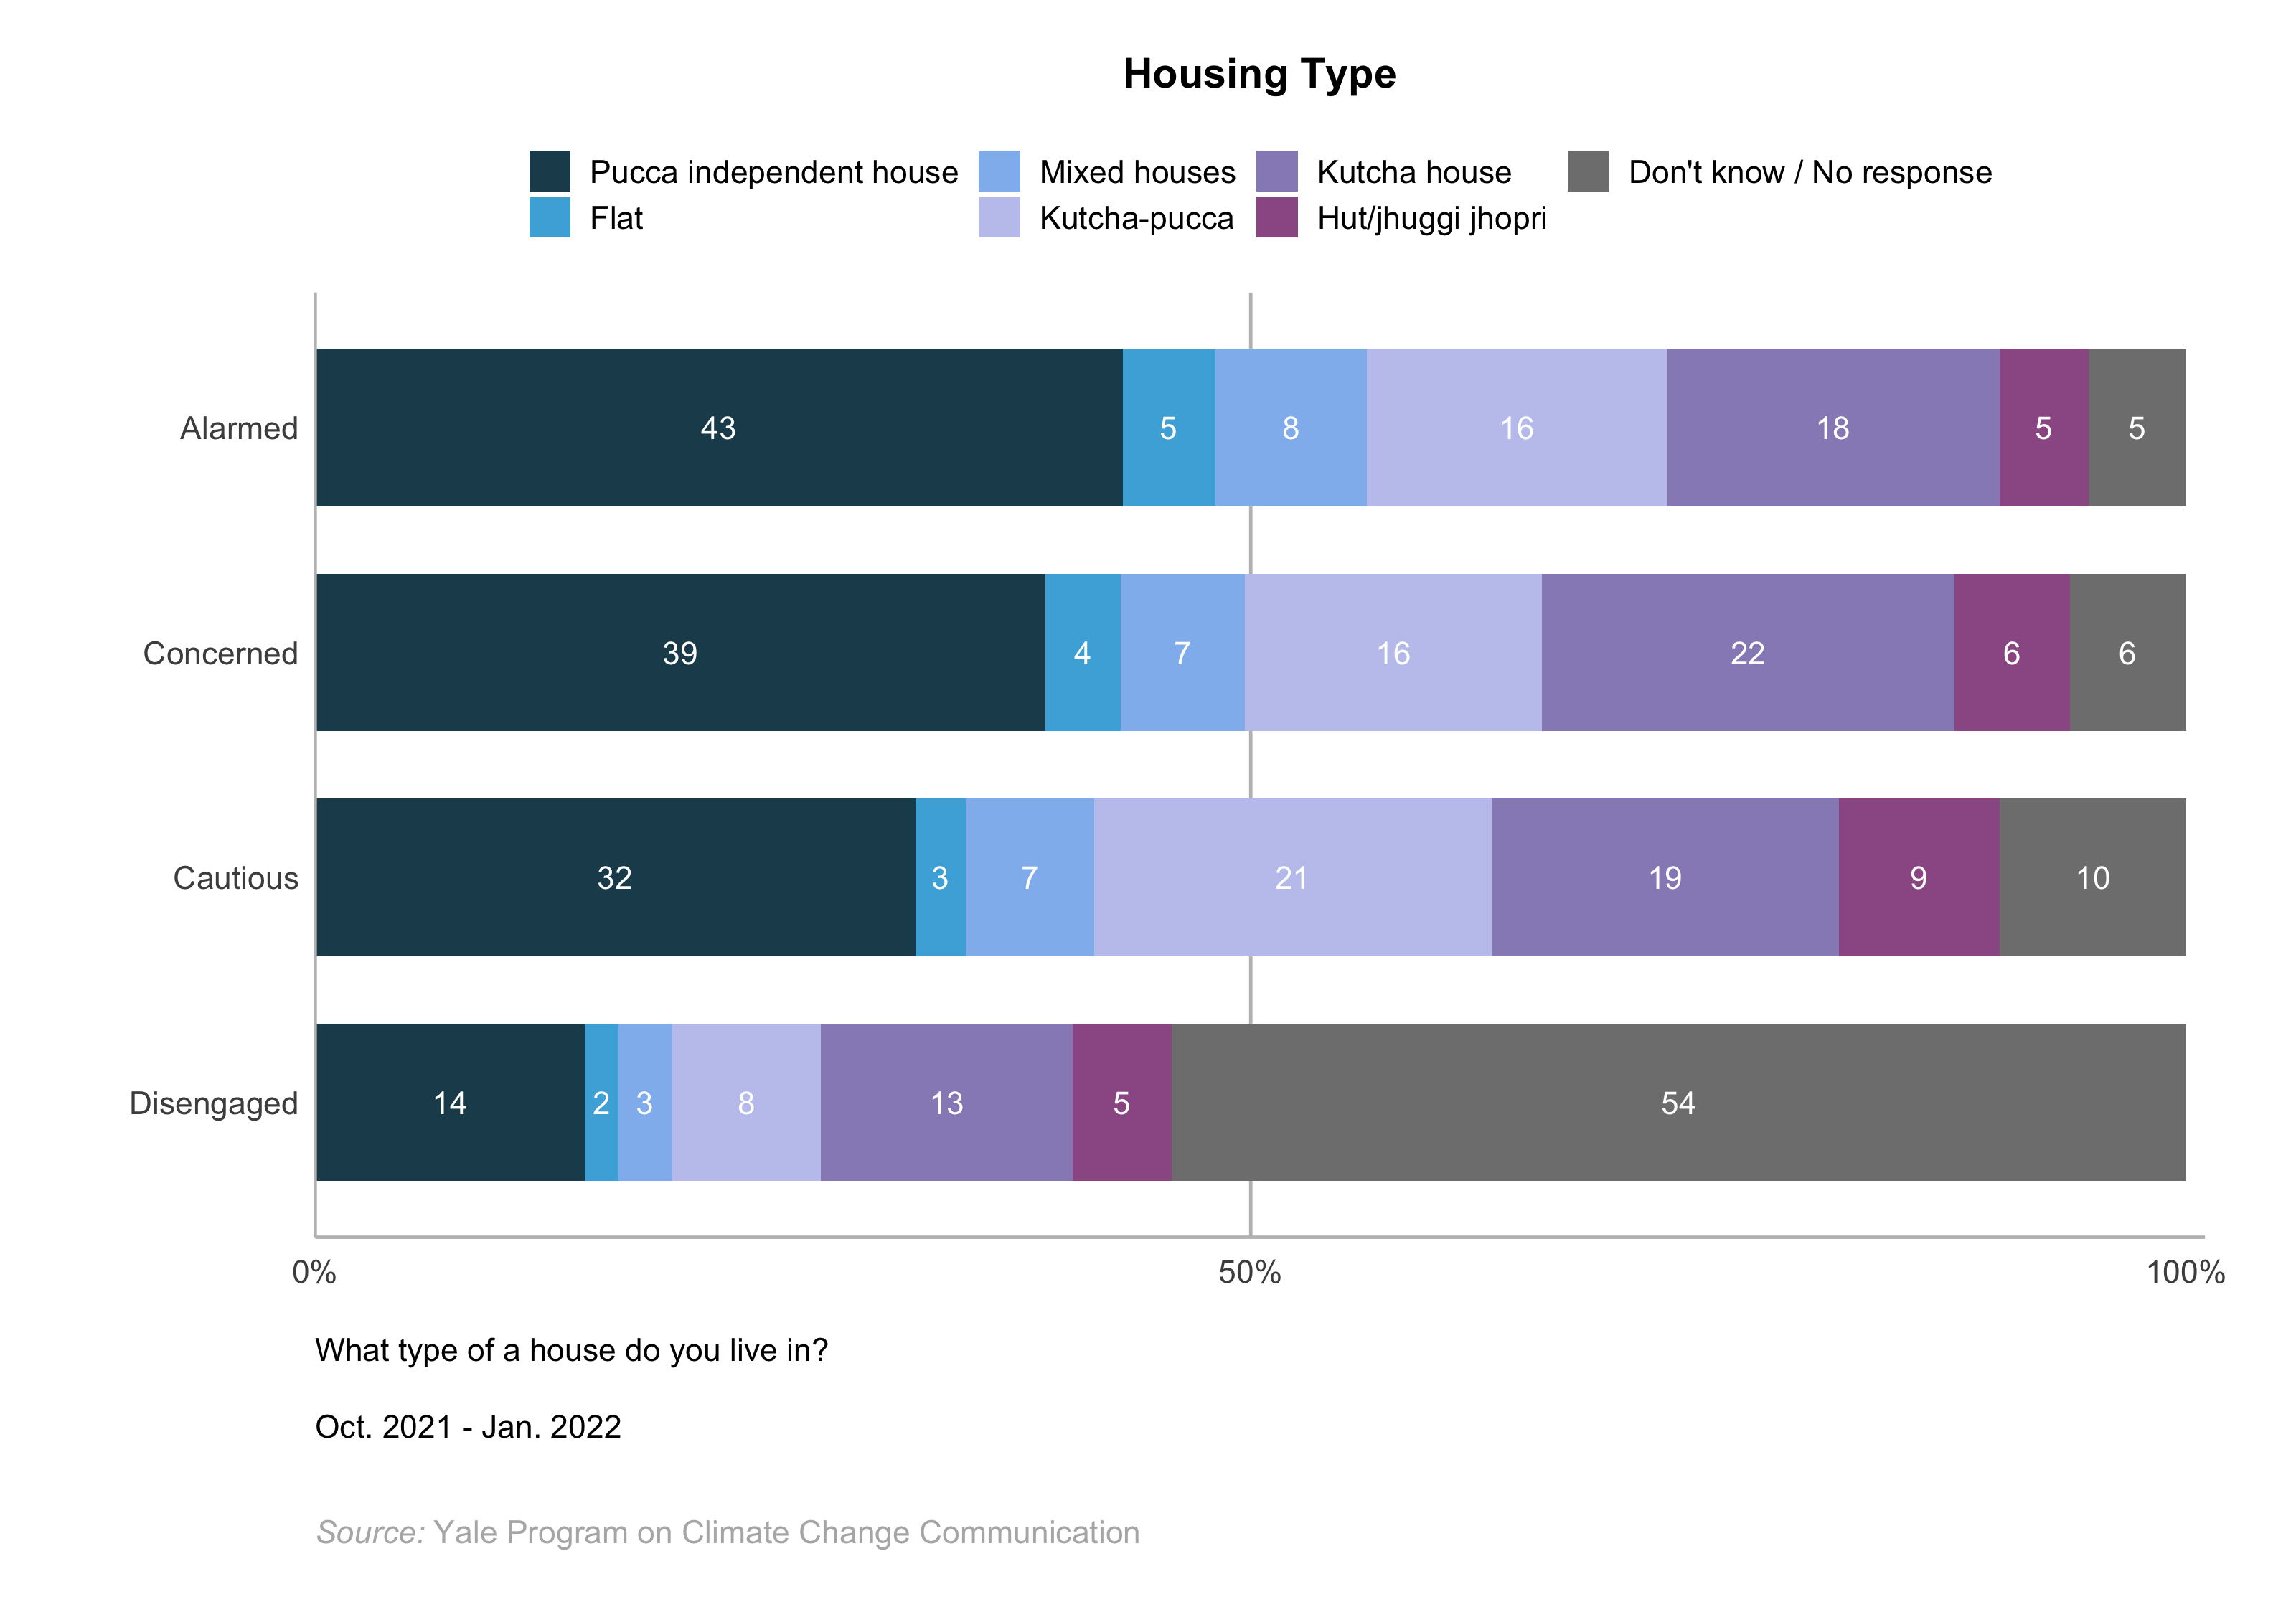
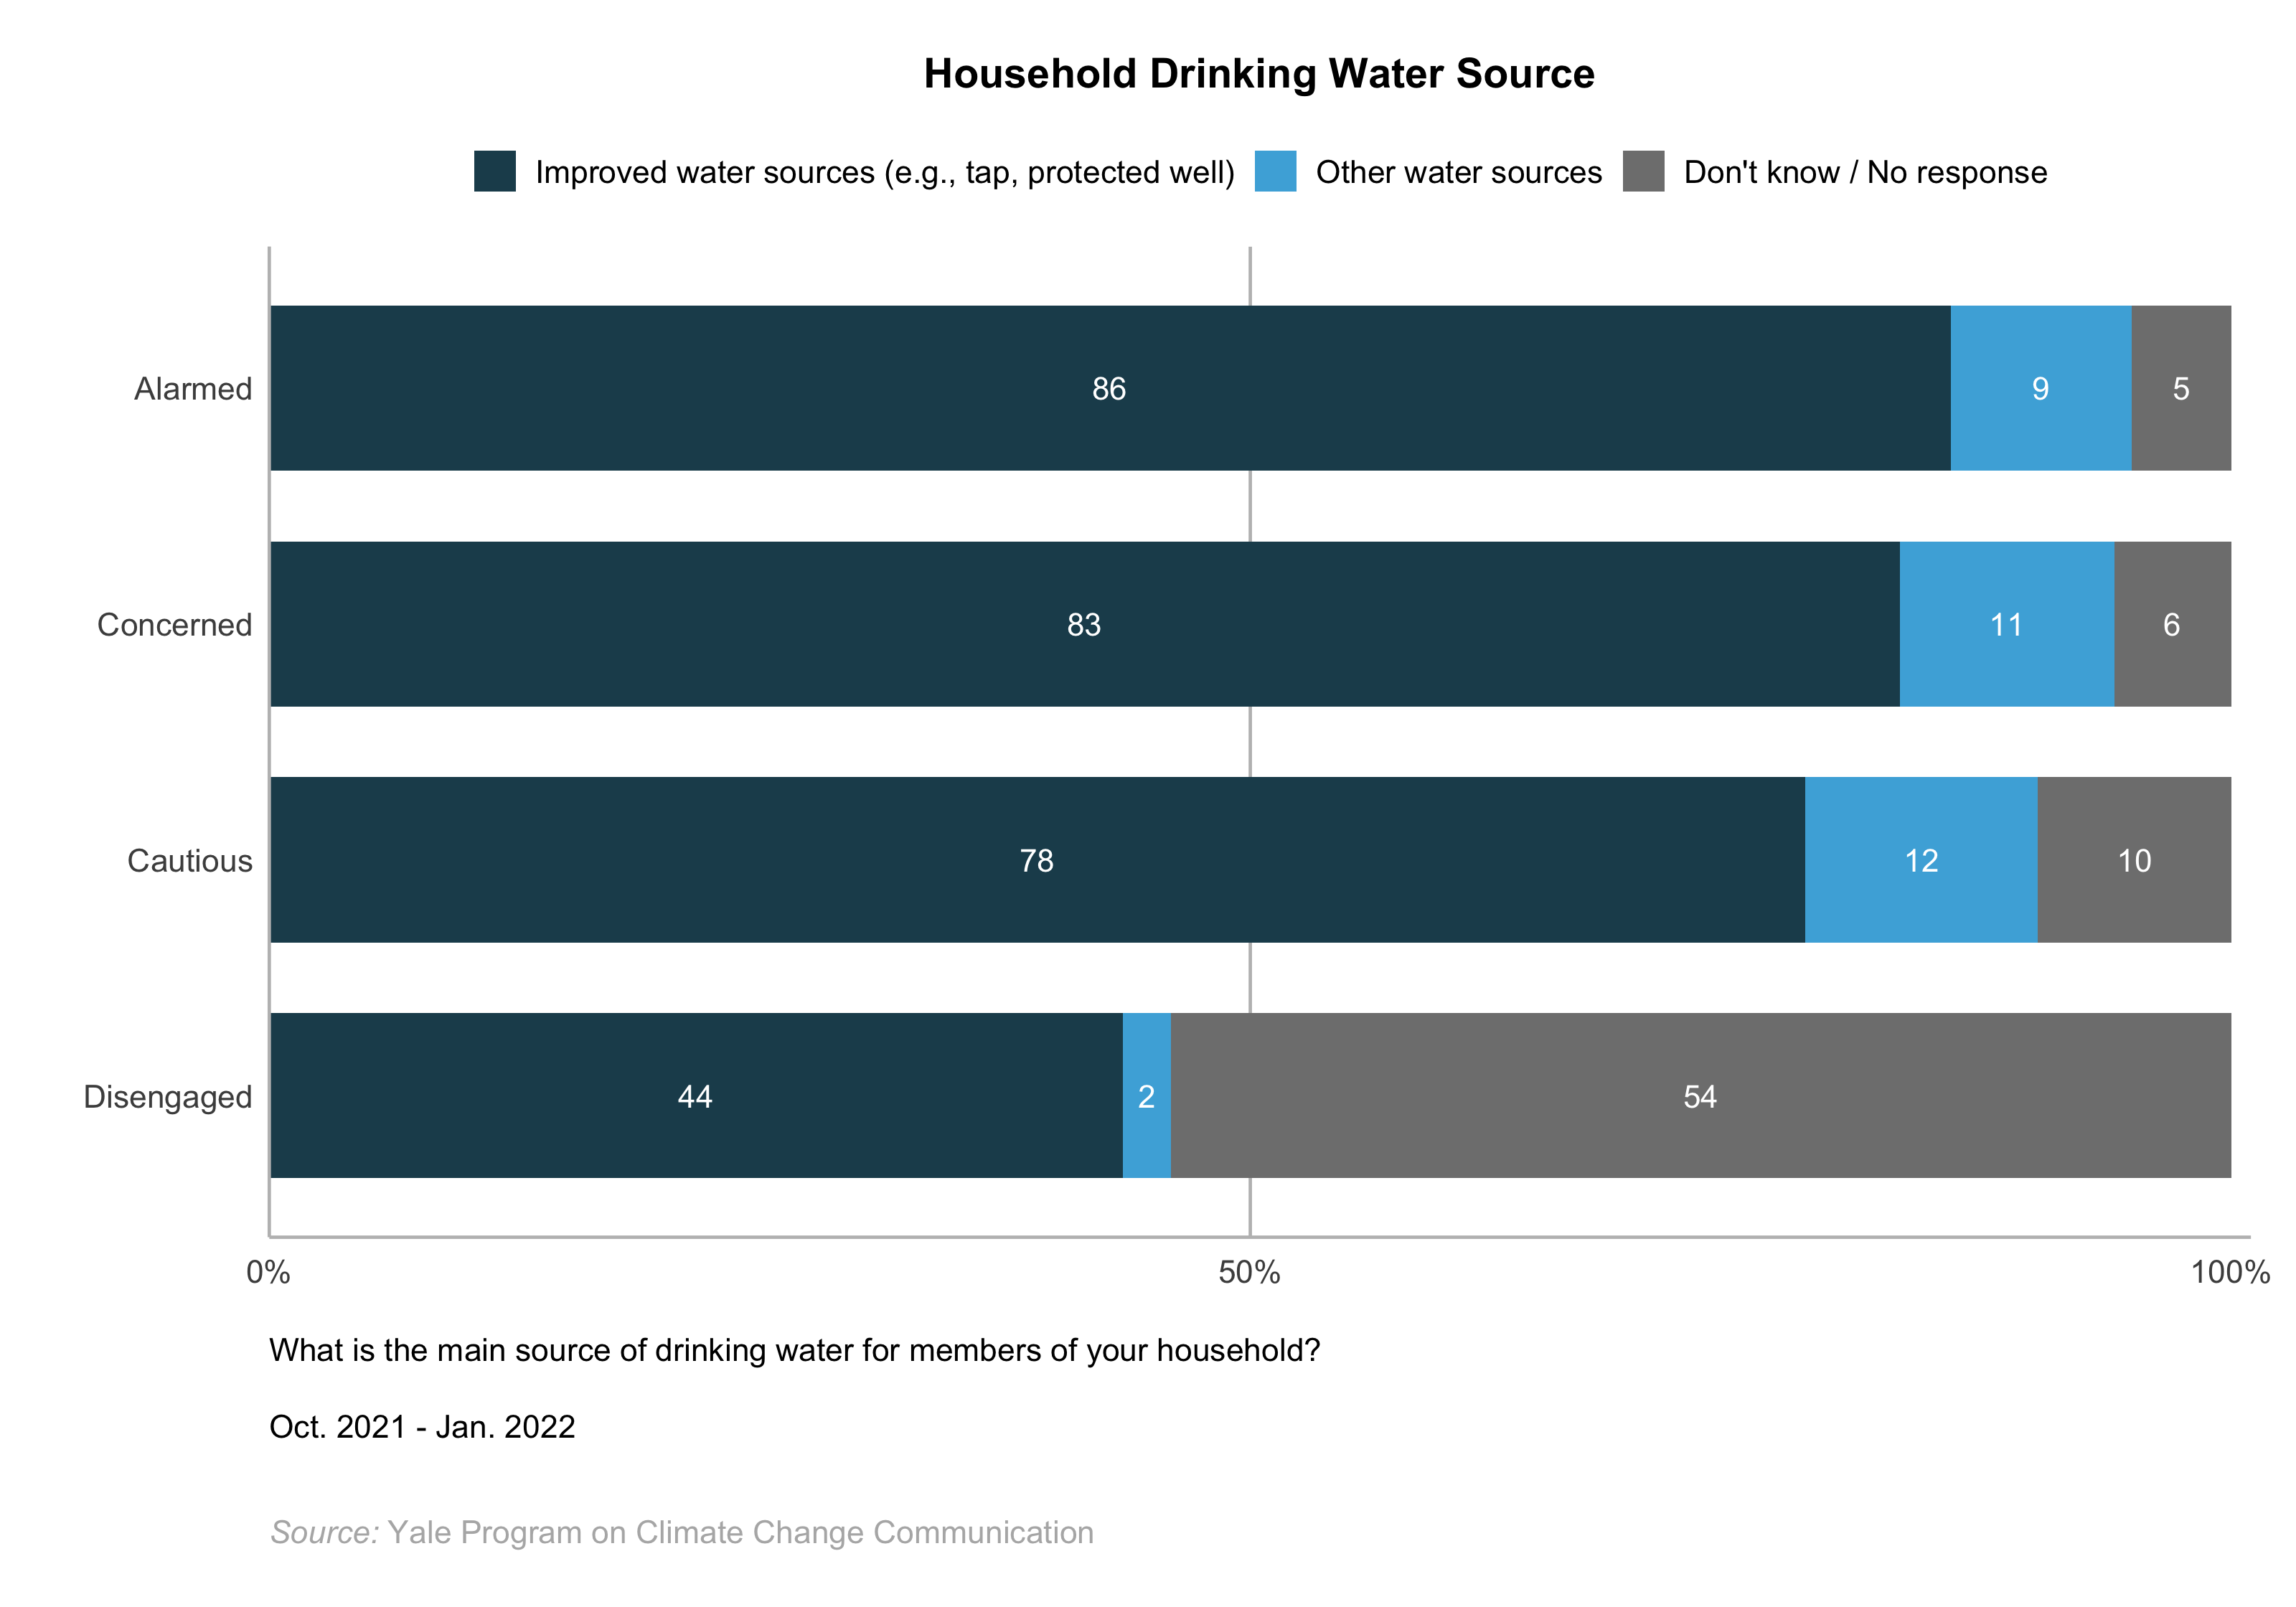
Measures of household characteristics include questions about housing type, homeownership status, electricity access, air conditioning, Internet access, drinking water source (e.g., tap, well water)Based on the Census of India, 2011, the following household drinking water sources were categorized as improved water sources: tap (piped into the house or yard/plot), public tap or standpipe/hand pump, tube well/borehole, protected well, and protected spring, and cooking fuel type (e.g., propane or natural gas, wood). For a complete list of household cooking fuel types and drinking water sources, refer to Appendix II: Demographic Tables (pp. 34-35) of the Climate Change in the Indian Mind, 2022 report.
Alarmed
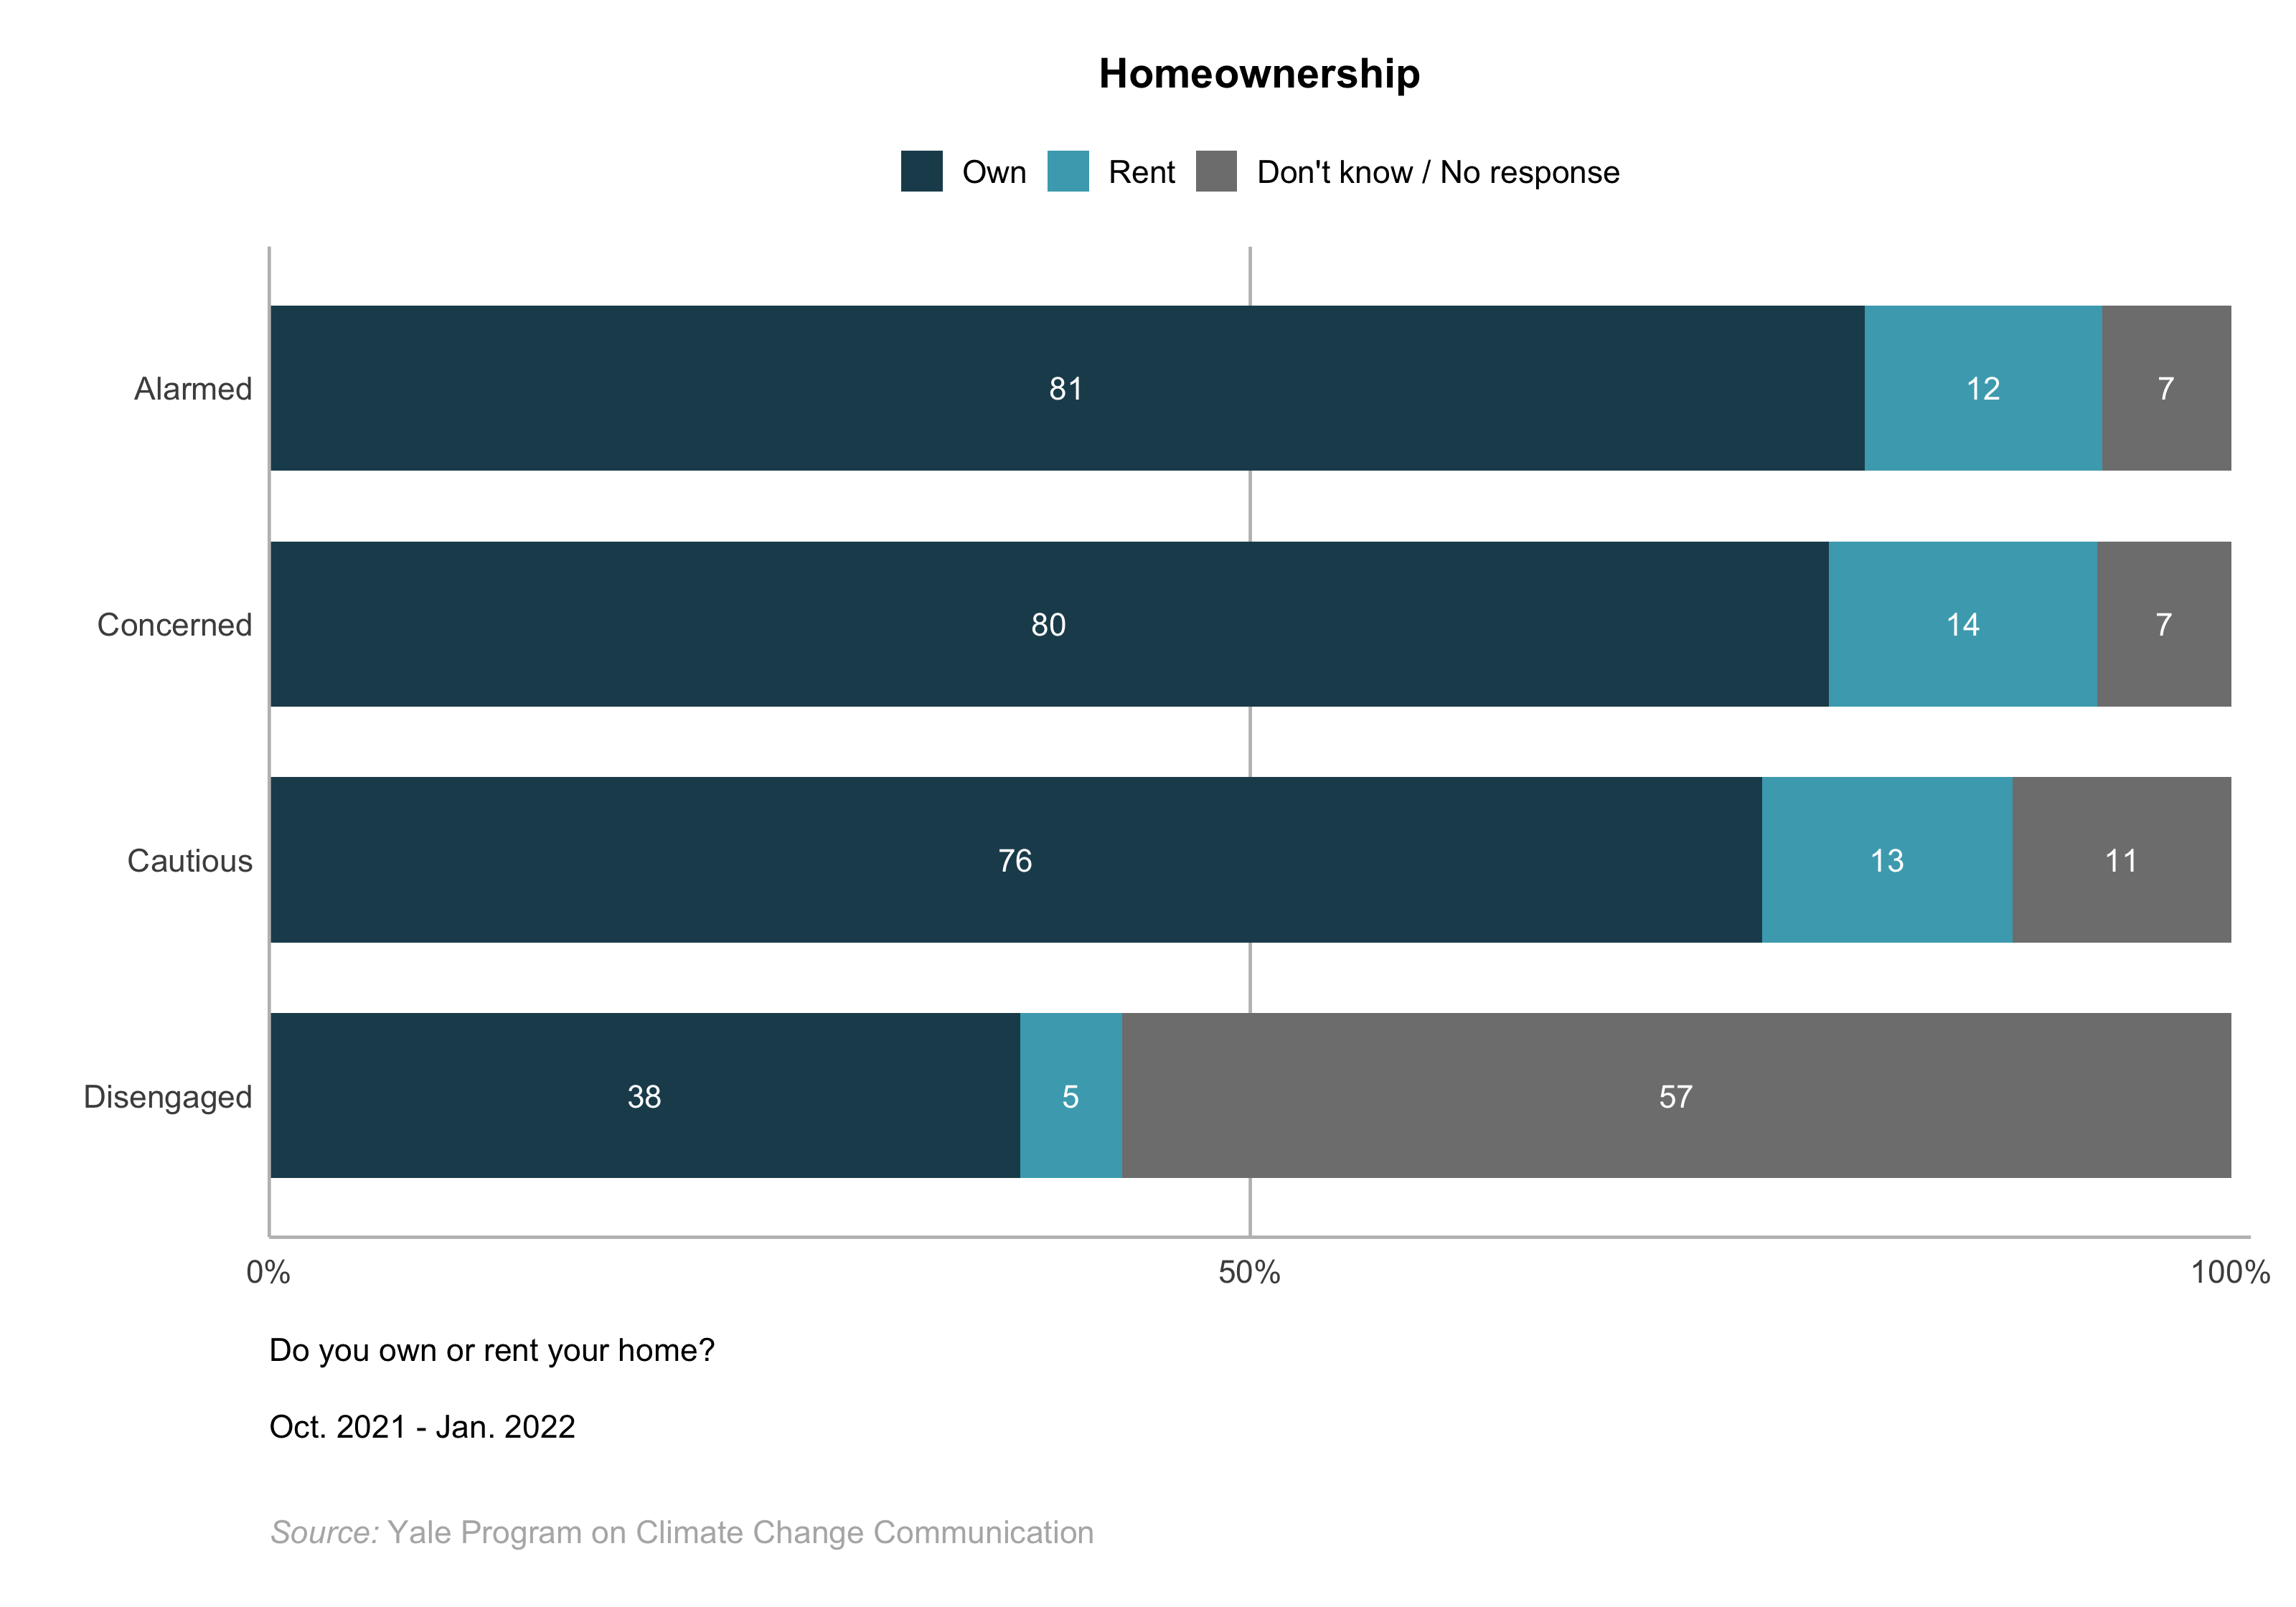
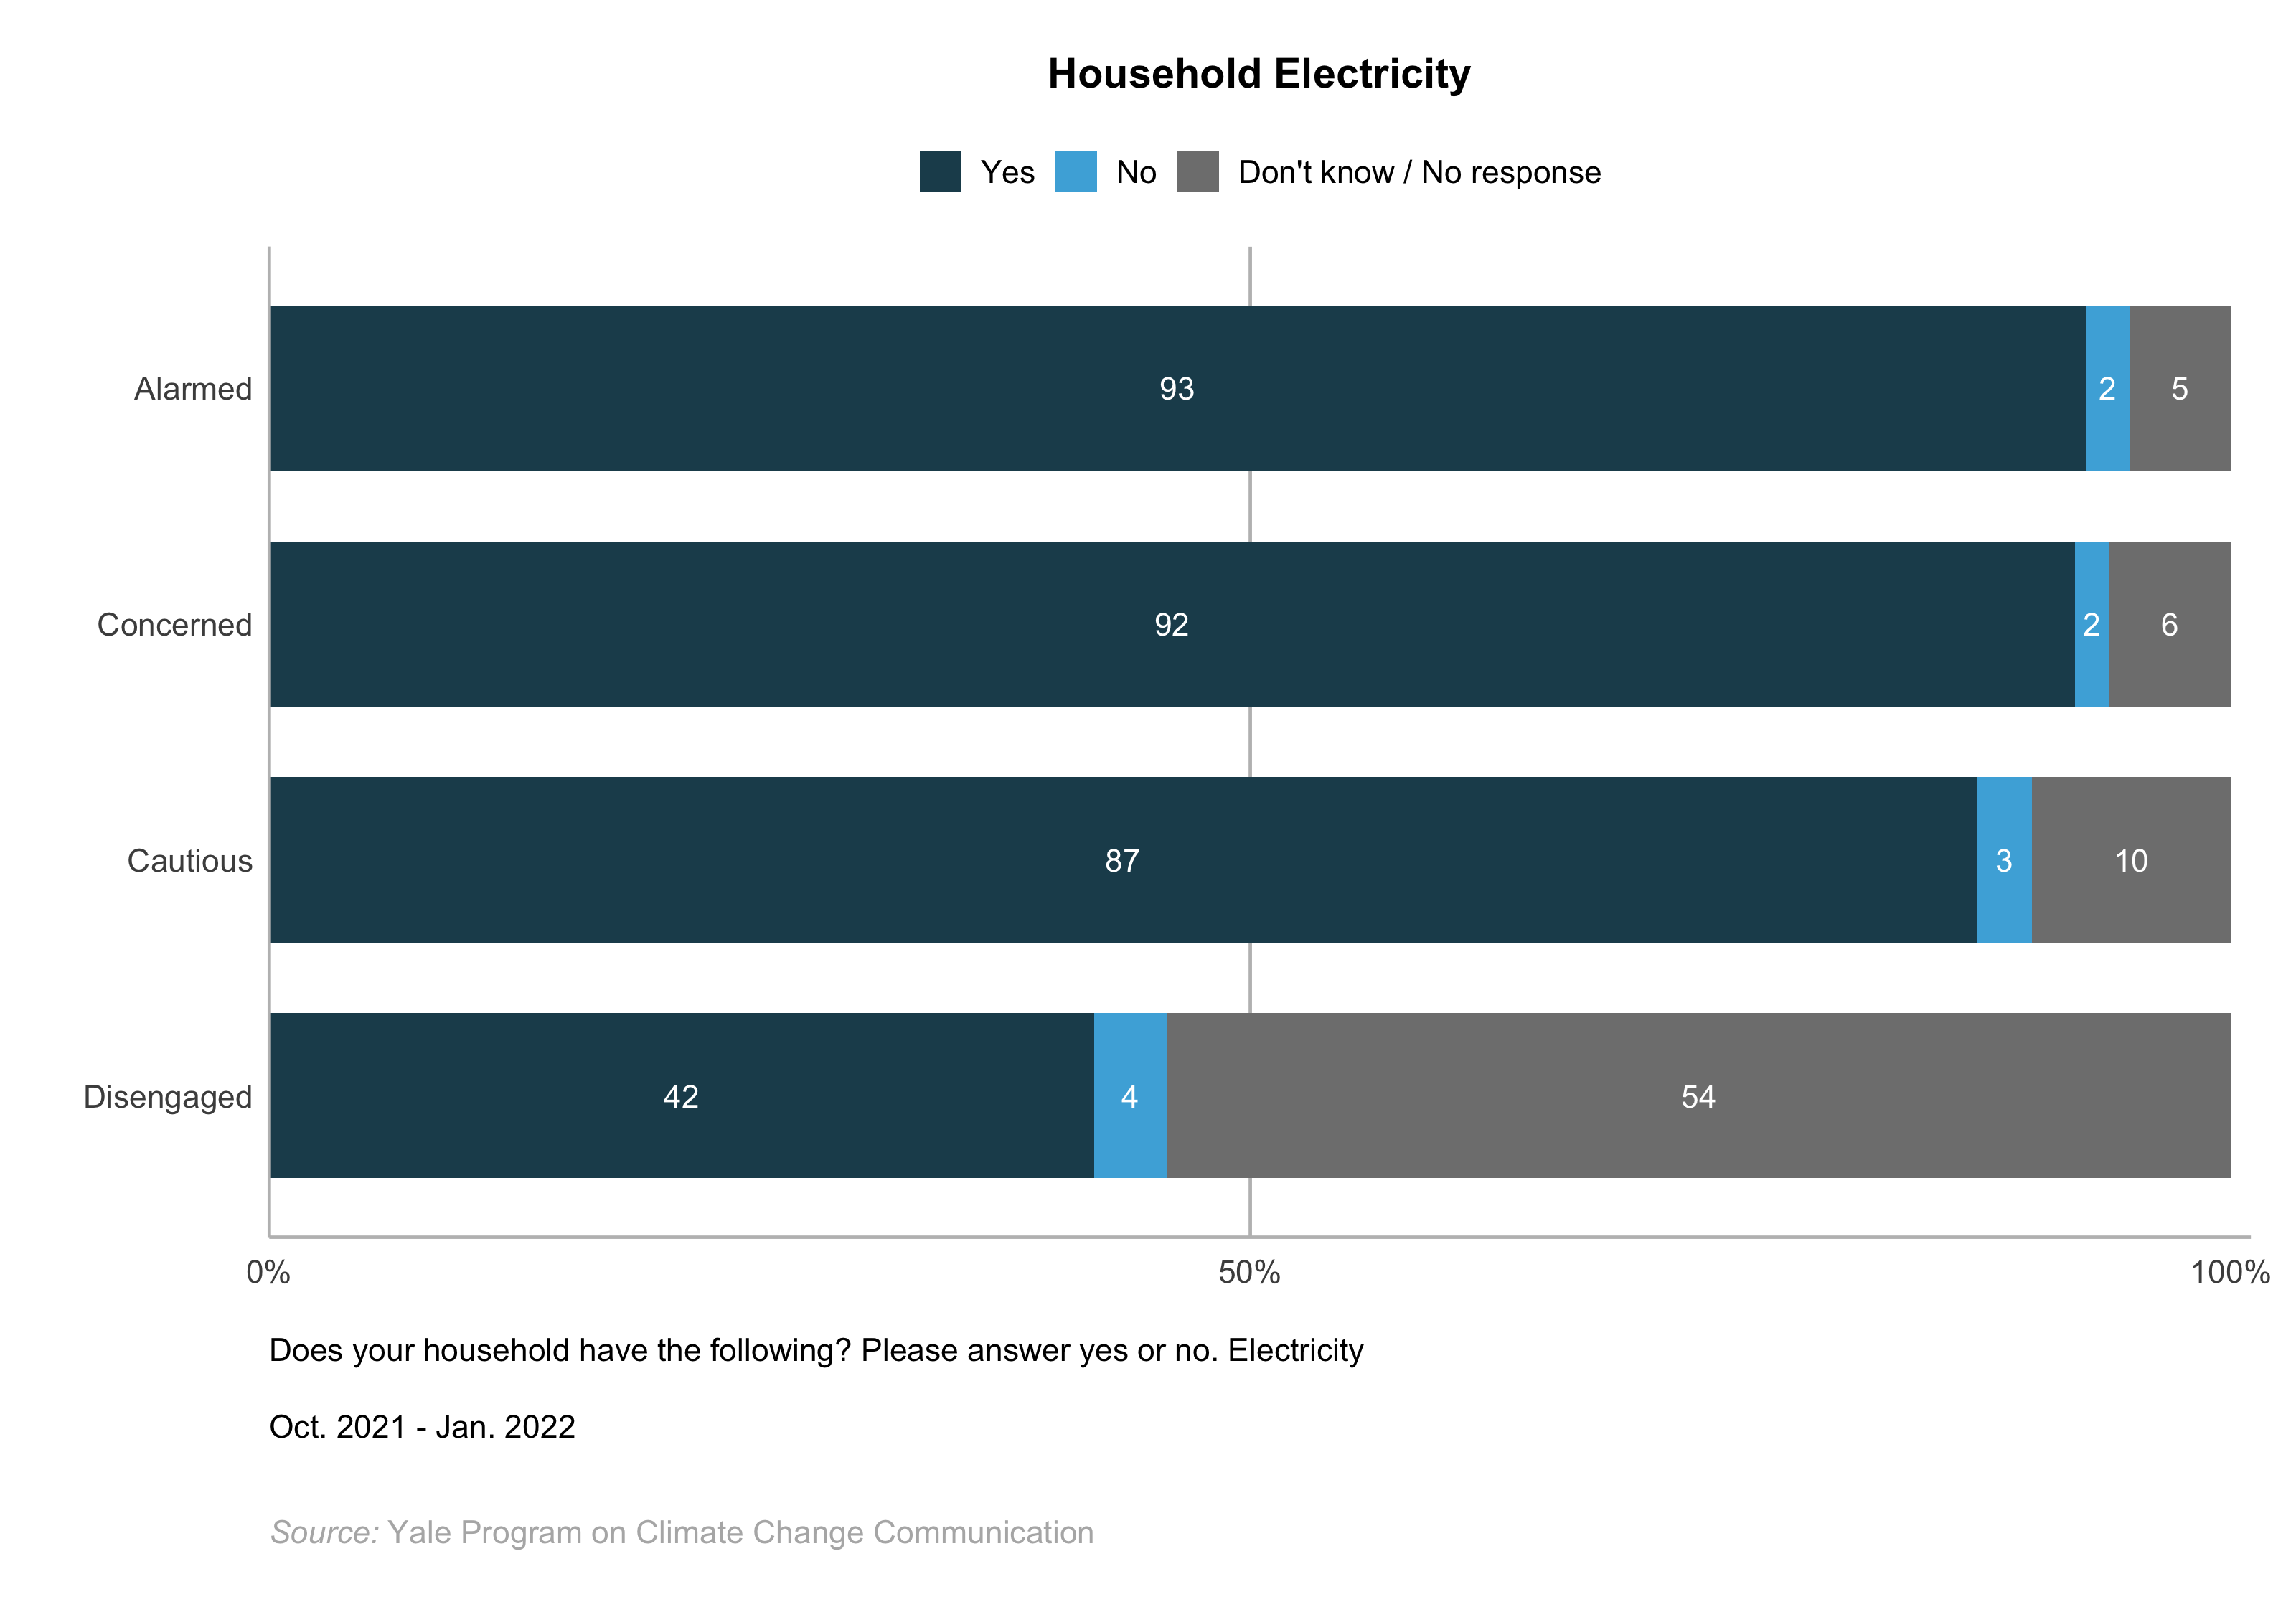
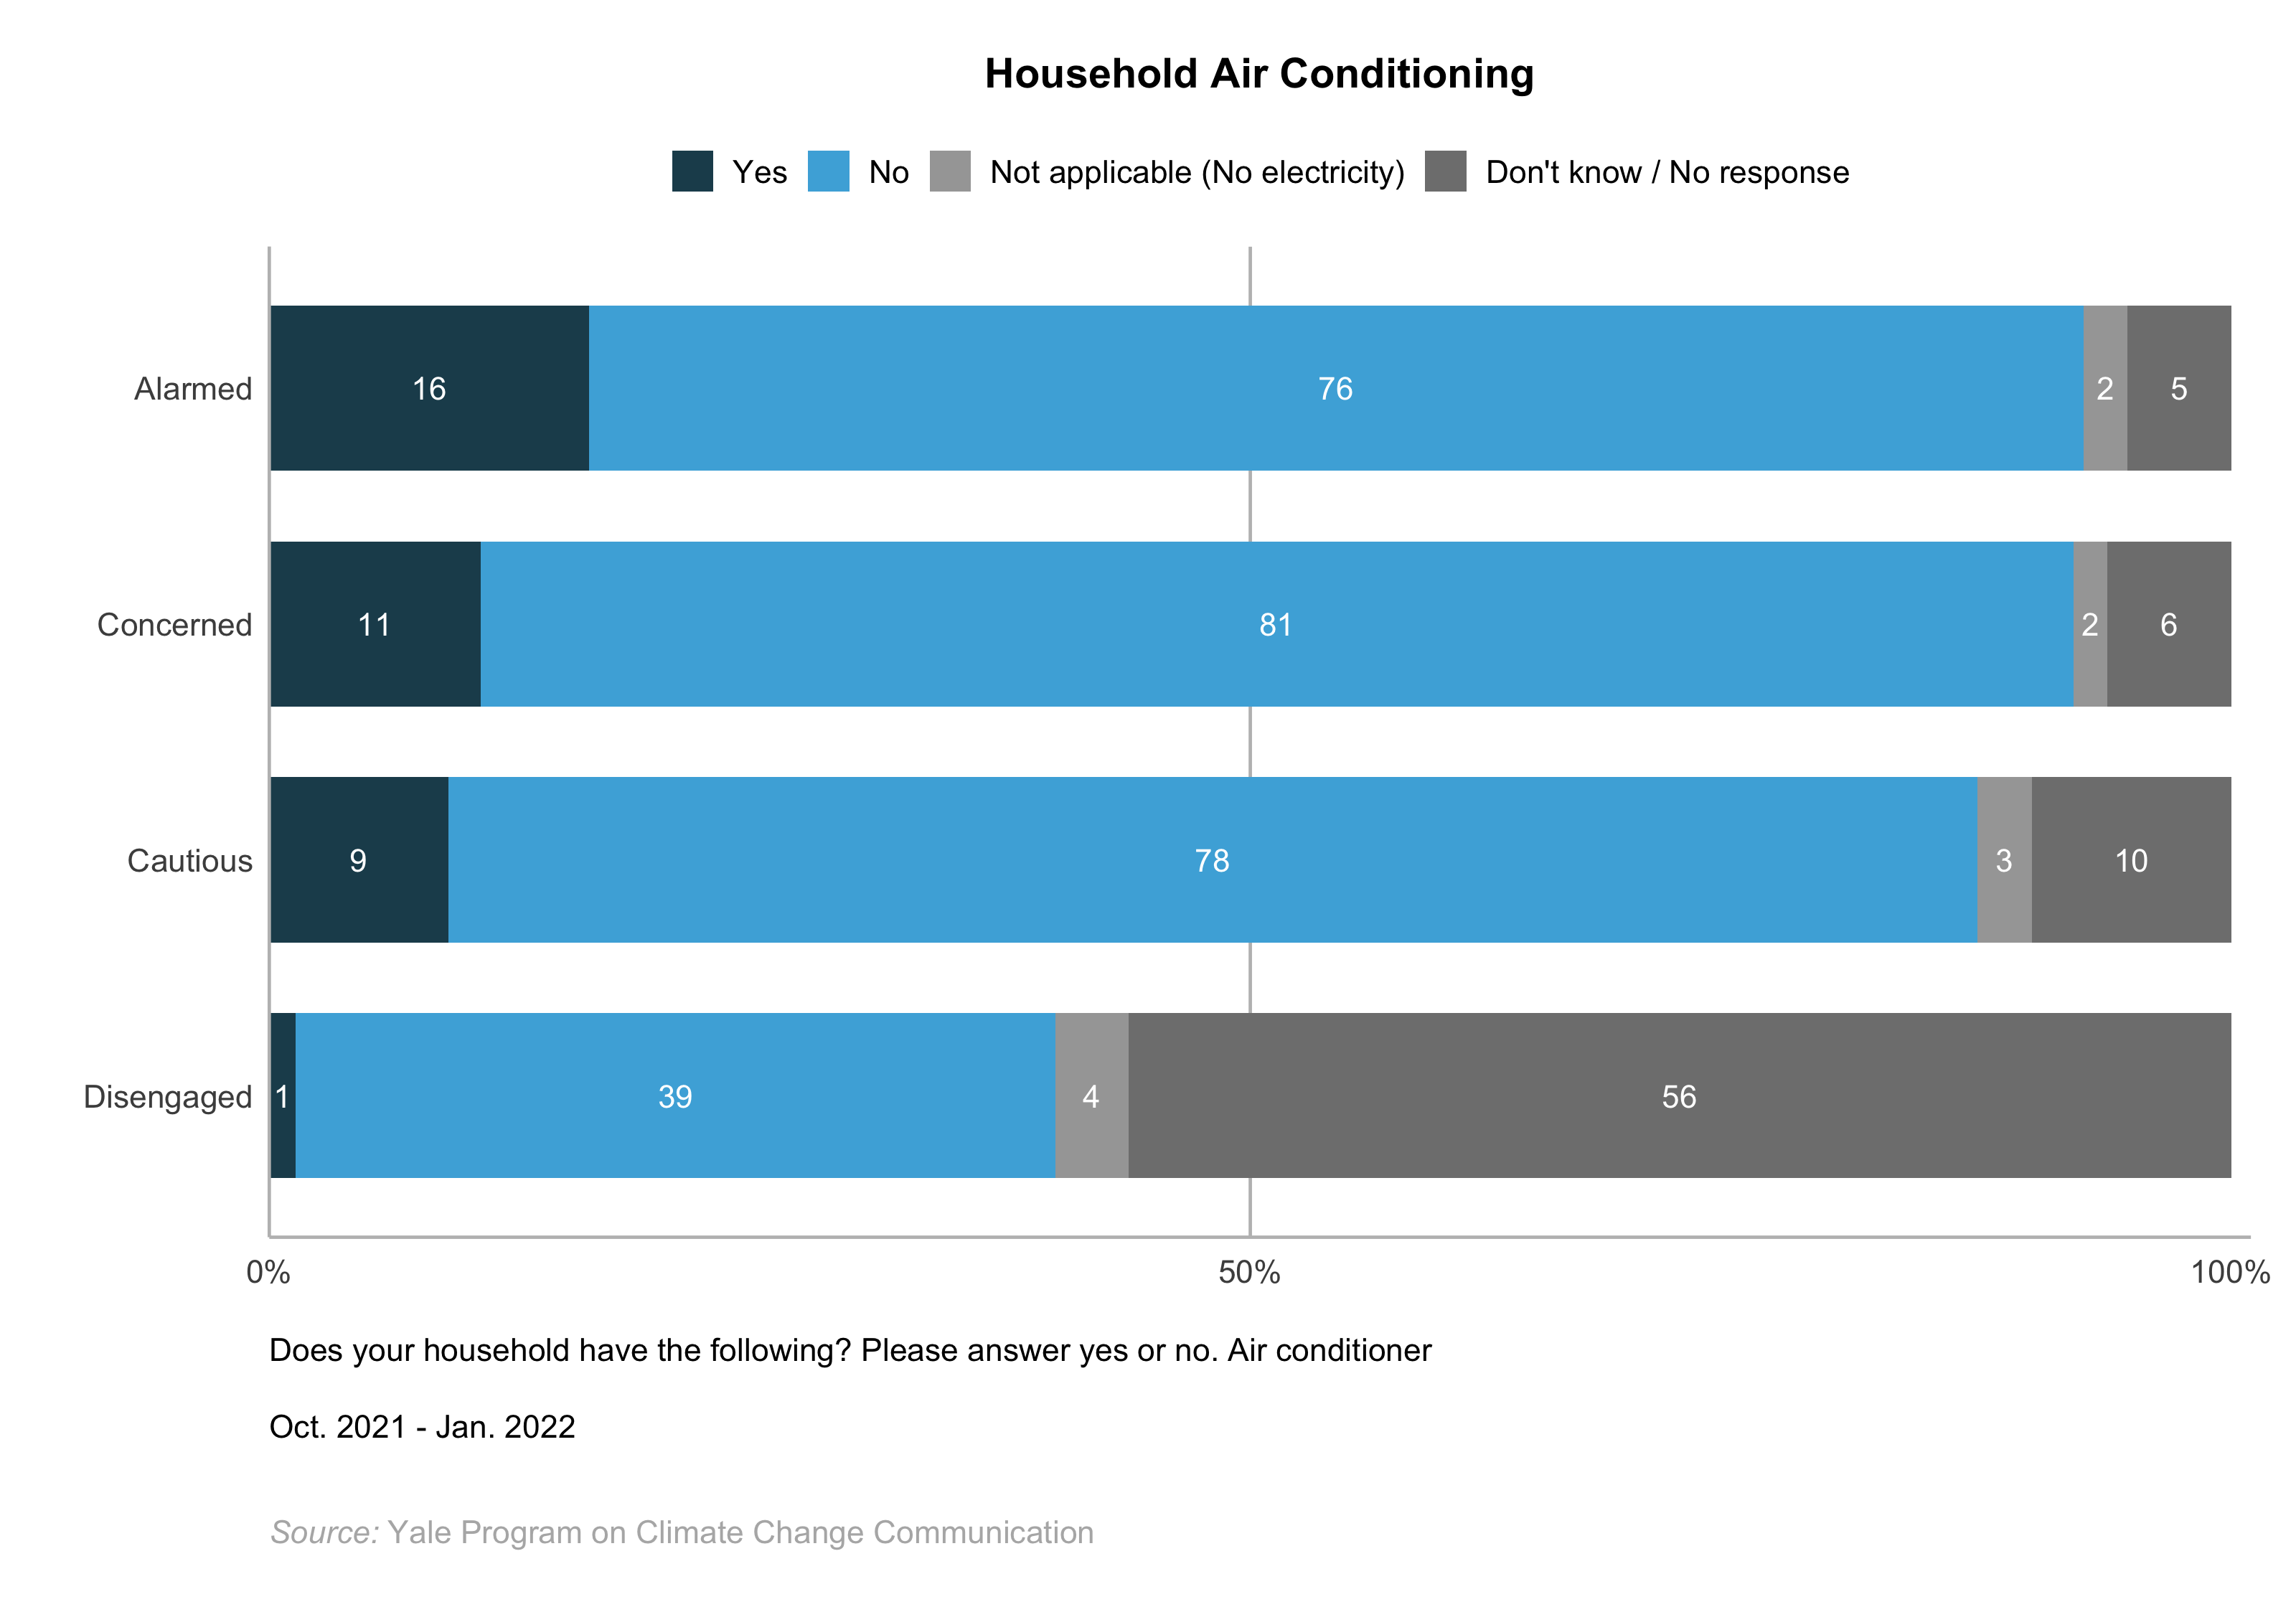
The Alarmed are the most likely segment to live in a pucca independent house (a house made with modern materials like brick and cement; 43%), and a large majority (81%) say they own their home. Nearly all of the Alarmed (93%) say they have access to electricity. The Alarmed are the most likely segment to say they have air conditioning (16%) and/or Internet access (71%). Additionally, the Alarmed are the most likely segment to have access to an improved drinking water source (e.g., tap water, protected wells; 86%). A majority of the Alarmed (60%) say they use propane or natural gas for cooking, while fewer say they use wood (27%) or other fuel types such as straw/grass or dung (9%).
Concerned
The Concerned are less likely than the Alarmed, but more likely than the Cautious, to live in a pucca independent house (39%). Like the Alarmed, a majority of the Concerned (81%) say they own their home. Also, like the Alarmed, nearly all of the Concerned (92%) say they have access to electricity. The Concerned are less likely than the Alarmed to have air conditioning (11%), Internet access (64%), and/or access to an improved drinking water source (83%). Most of the Concerned (61%), like the Alarmed, say they use propane or natural gas for cooking, while fewer say they use wood (24%) or other fuel types (9%).
Cautious
The Cautious are less likely than both the Alarmed and Concerned to live in a pucca independent house (32%), and are more likely to live in a kutcha-pucca house (21%) made with a mix of permanent materials such as bricks and cement and traditional construction materials such as mud. A majority of the Cautious (76%) say they own their home, but they are less likely than the Alarmed to say so. A large majority of the Cautious (87%) say they have access to electricity, but to a lesser extent than the Alarmed and Concerned. The Cautious are less likely than the Alarmed to have air conditioning (9%), and they are less likely than both the Alarmed and Concerned to have access to the Internet (53%) and/or access to an improved drinking water source (78%). Compared with the Alarmed and Concerned, fewer of the Cautious (47%) say they use propane or natural gas for cooking, and a larger percentage (42%) say they use either wood (29%) or other fuel types (13%).
Disengaged
The Disengaged are the segment most likely to say they don’t know or to not provide a response when asked about their households (ranging from 54% to 57% across questions). Few of the Disengaged (14%) say they live in a pucca independent house, and 38% say they own their home. Forty-two percent of the Disengaged say they have access to electricity, and few say they have air conditioning (1%) and/or Internet access (24%). Forty-four percent of the Disengaged say they have access to an improved drinking water source, and 22% say they use propane or natural gas for cooking.