Report · May 4, 2023
Global Warming’s Four Indias, 2022: An Audience Segmentation Analysis
By Anthony Leiserowitz, Jagadish Thaker, Matthew Goldberg, Matthew Ballew, Seth Rosenthal, Jennifer Carman, Liz Neyens, Sanguk Lee, Yashwant Deshmukh, Gaura Shukla and Jennifer Marlon
Filed under: Beliefs & Attitudes, Policy & Politics, Behaviors & Actions and Audiences
7. Demographics and Social Characteristics
Measures of demographics and social characteristics include respondents’ educational attainment, monthly family income, age, gender, location, voting behavior, religion, and caste. The demographics of the full sample can be found in Appendix II: Demographic Tables (pp. 32-35) of the Climate Change in the Indian Mind, 2022 report.
Alarmed
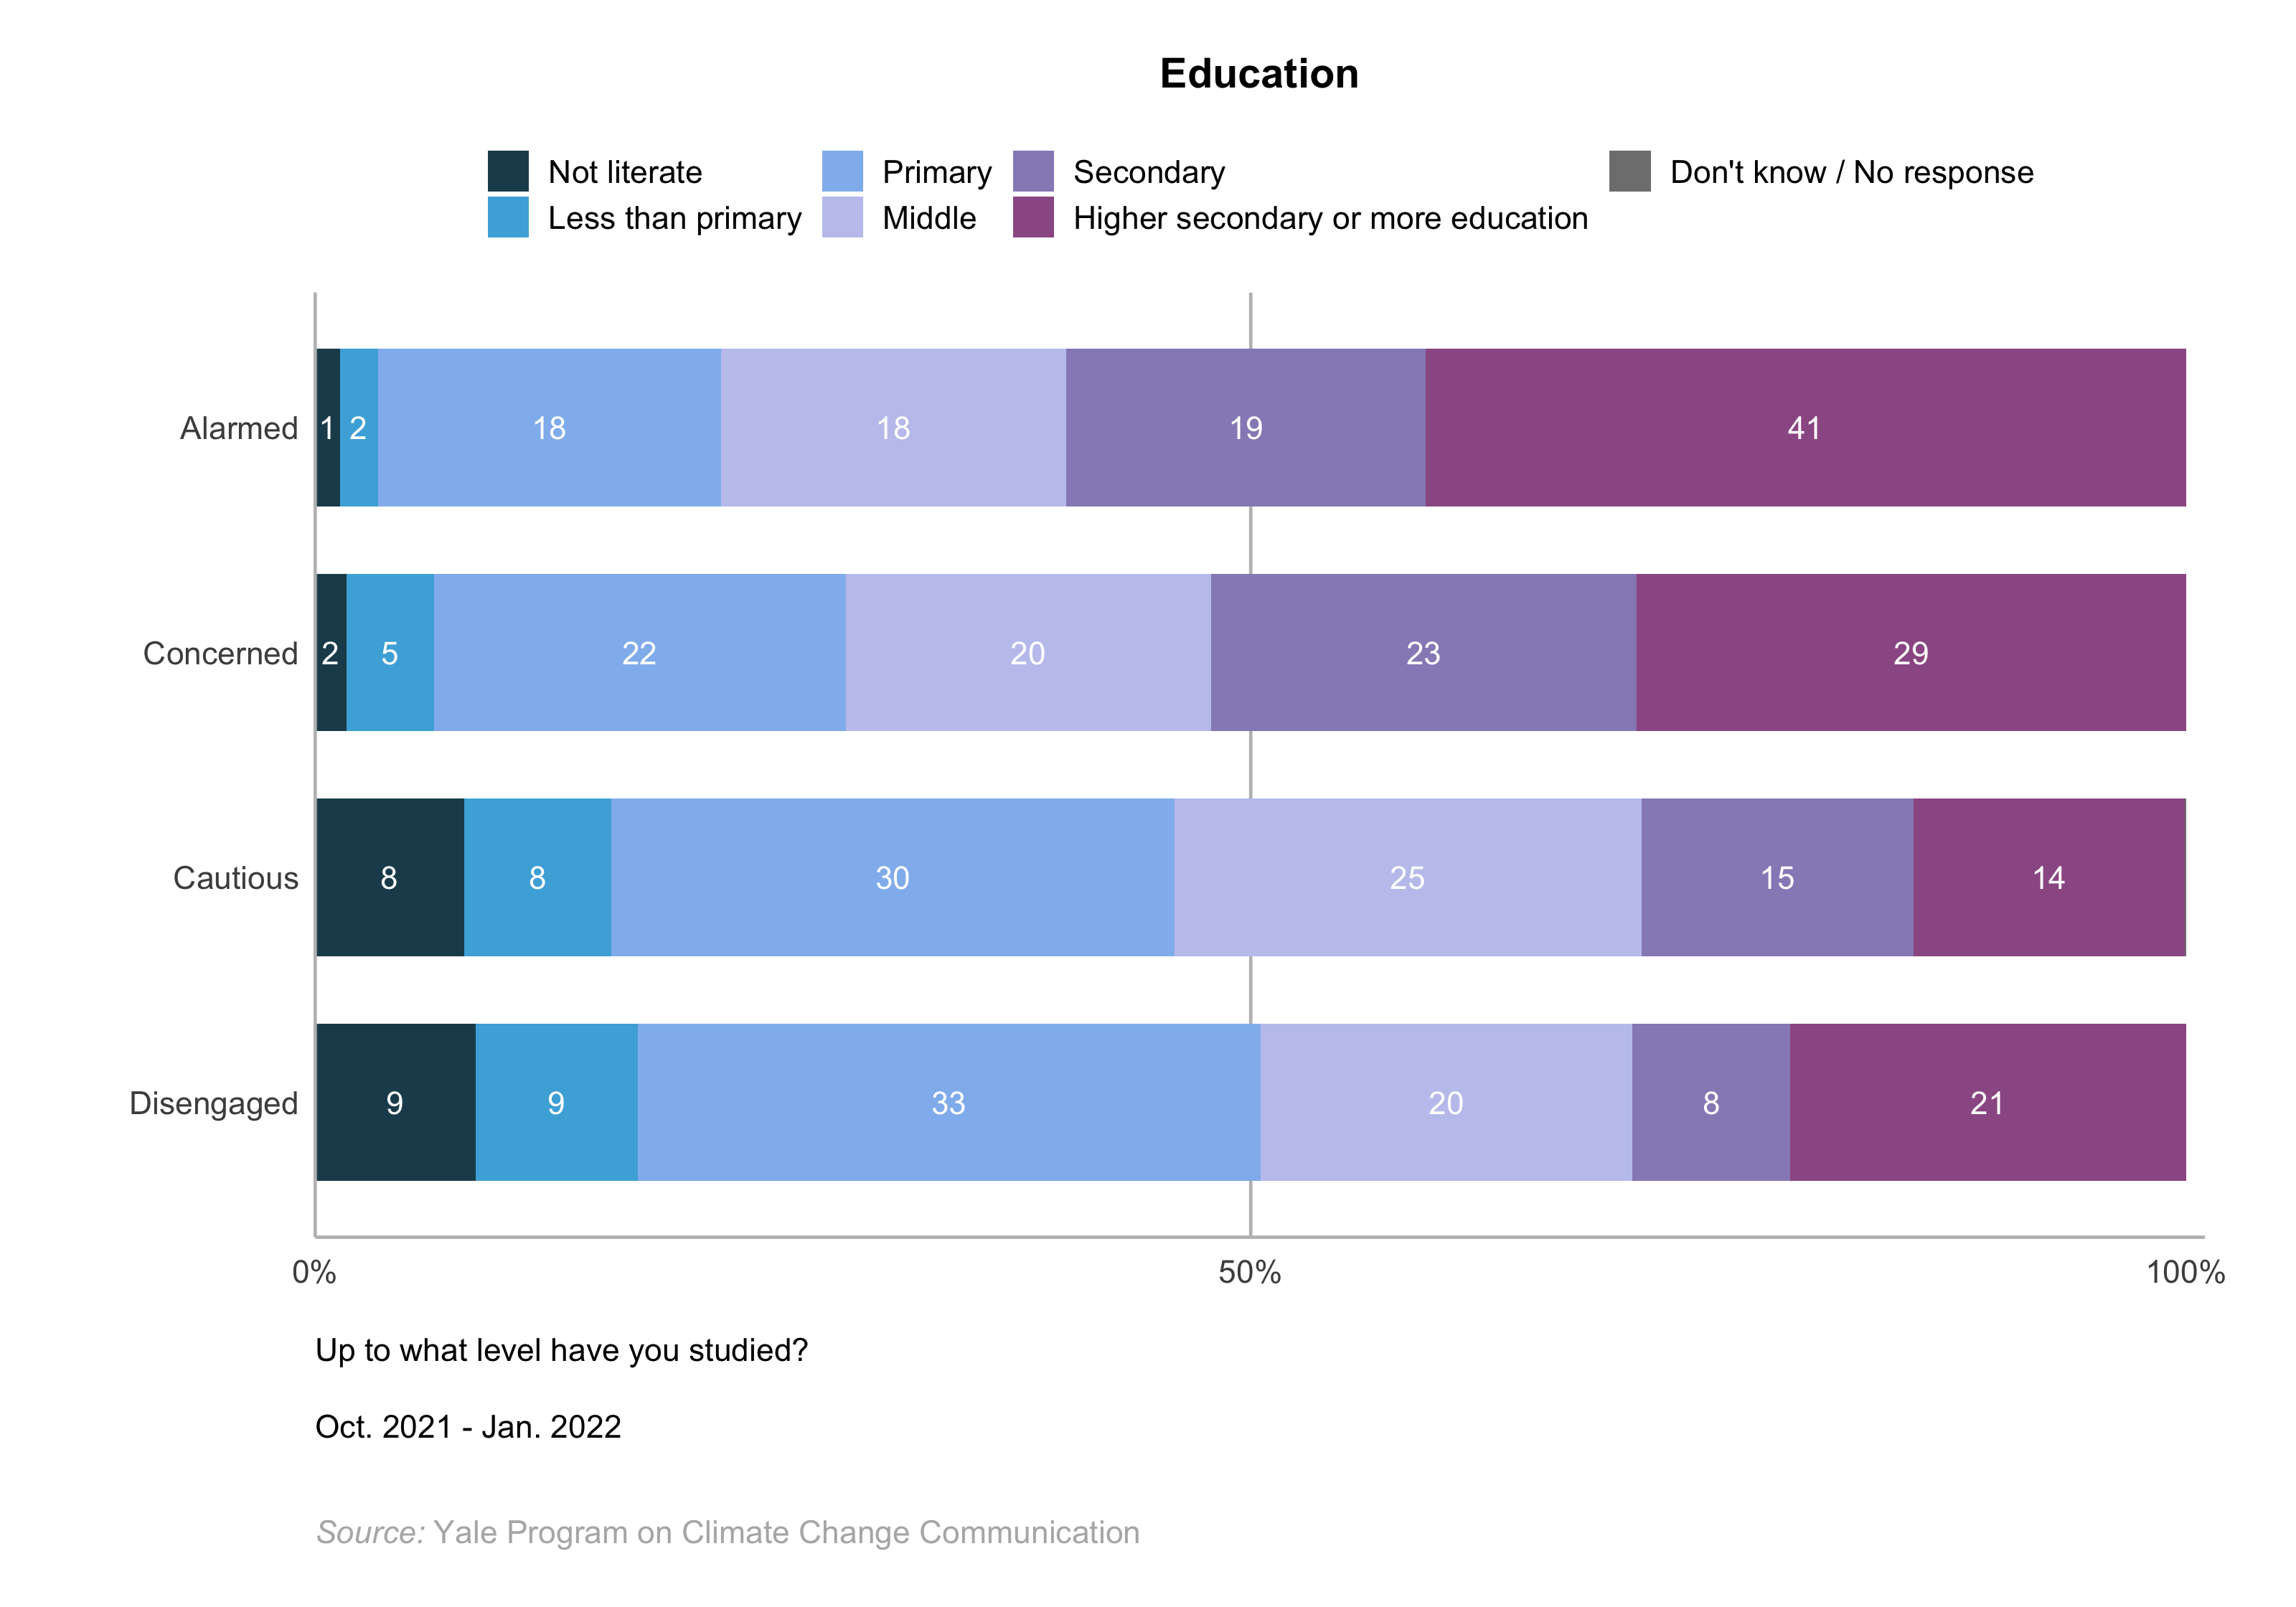
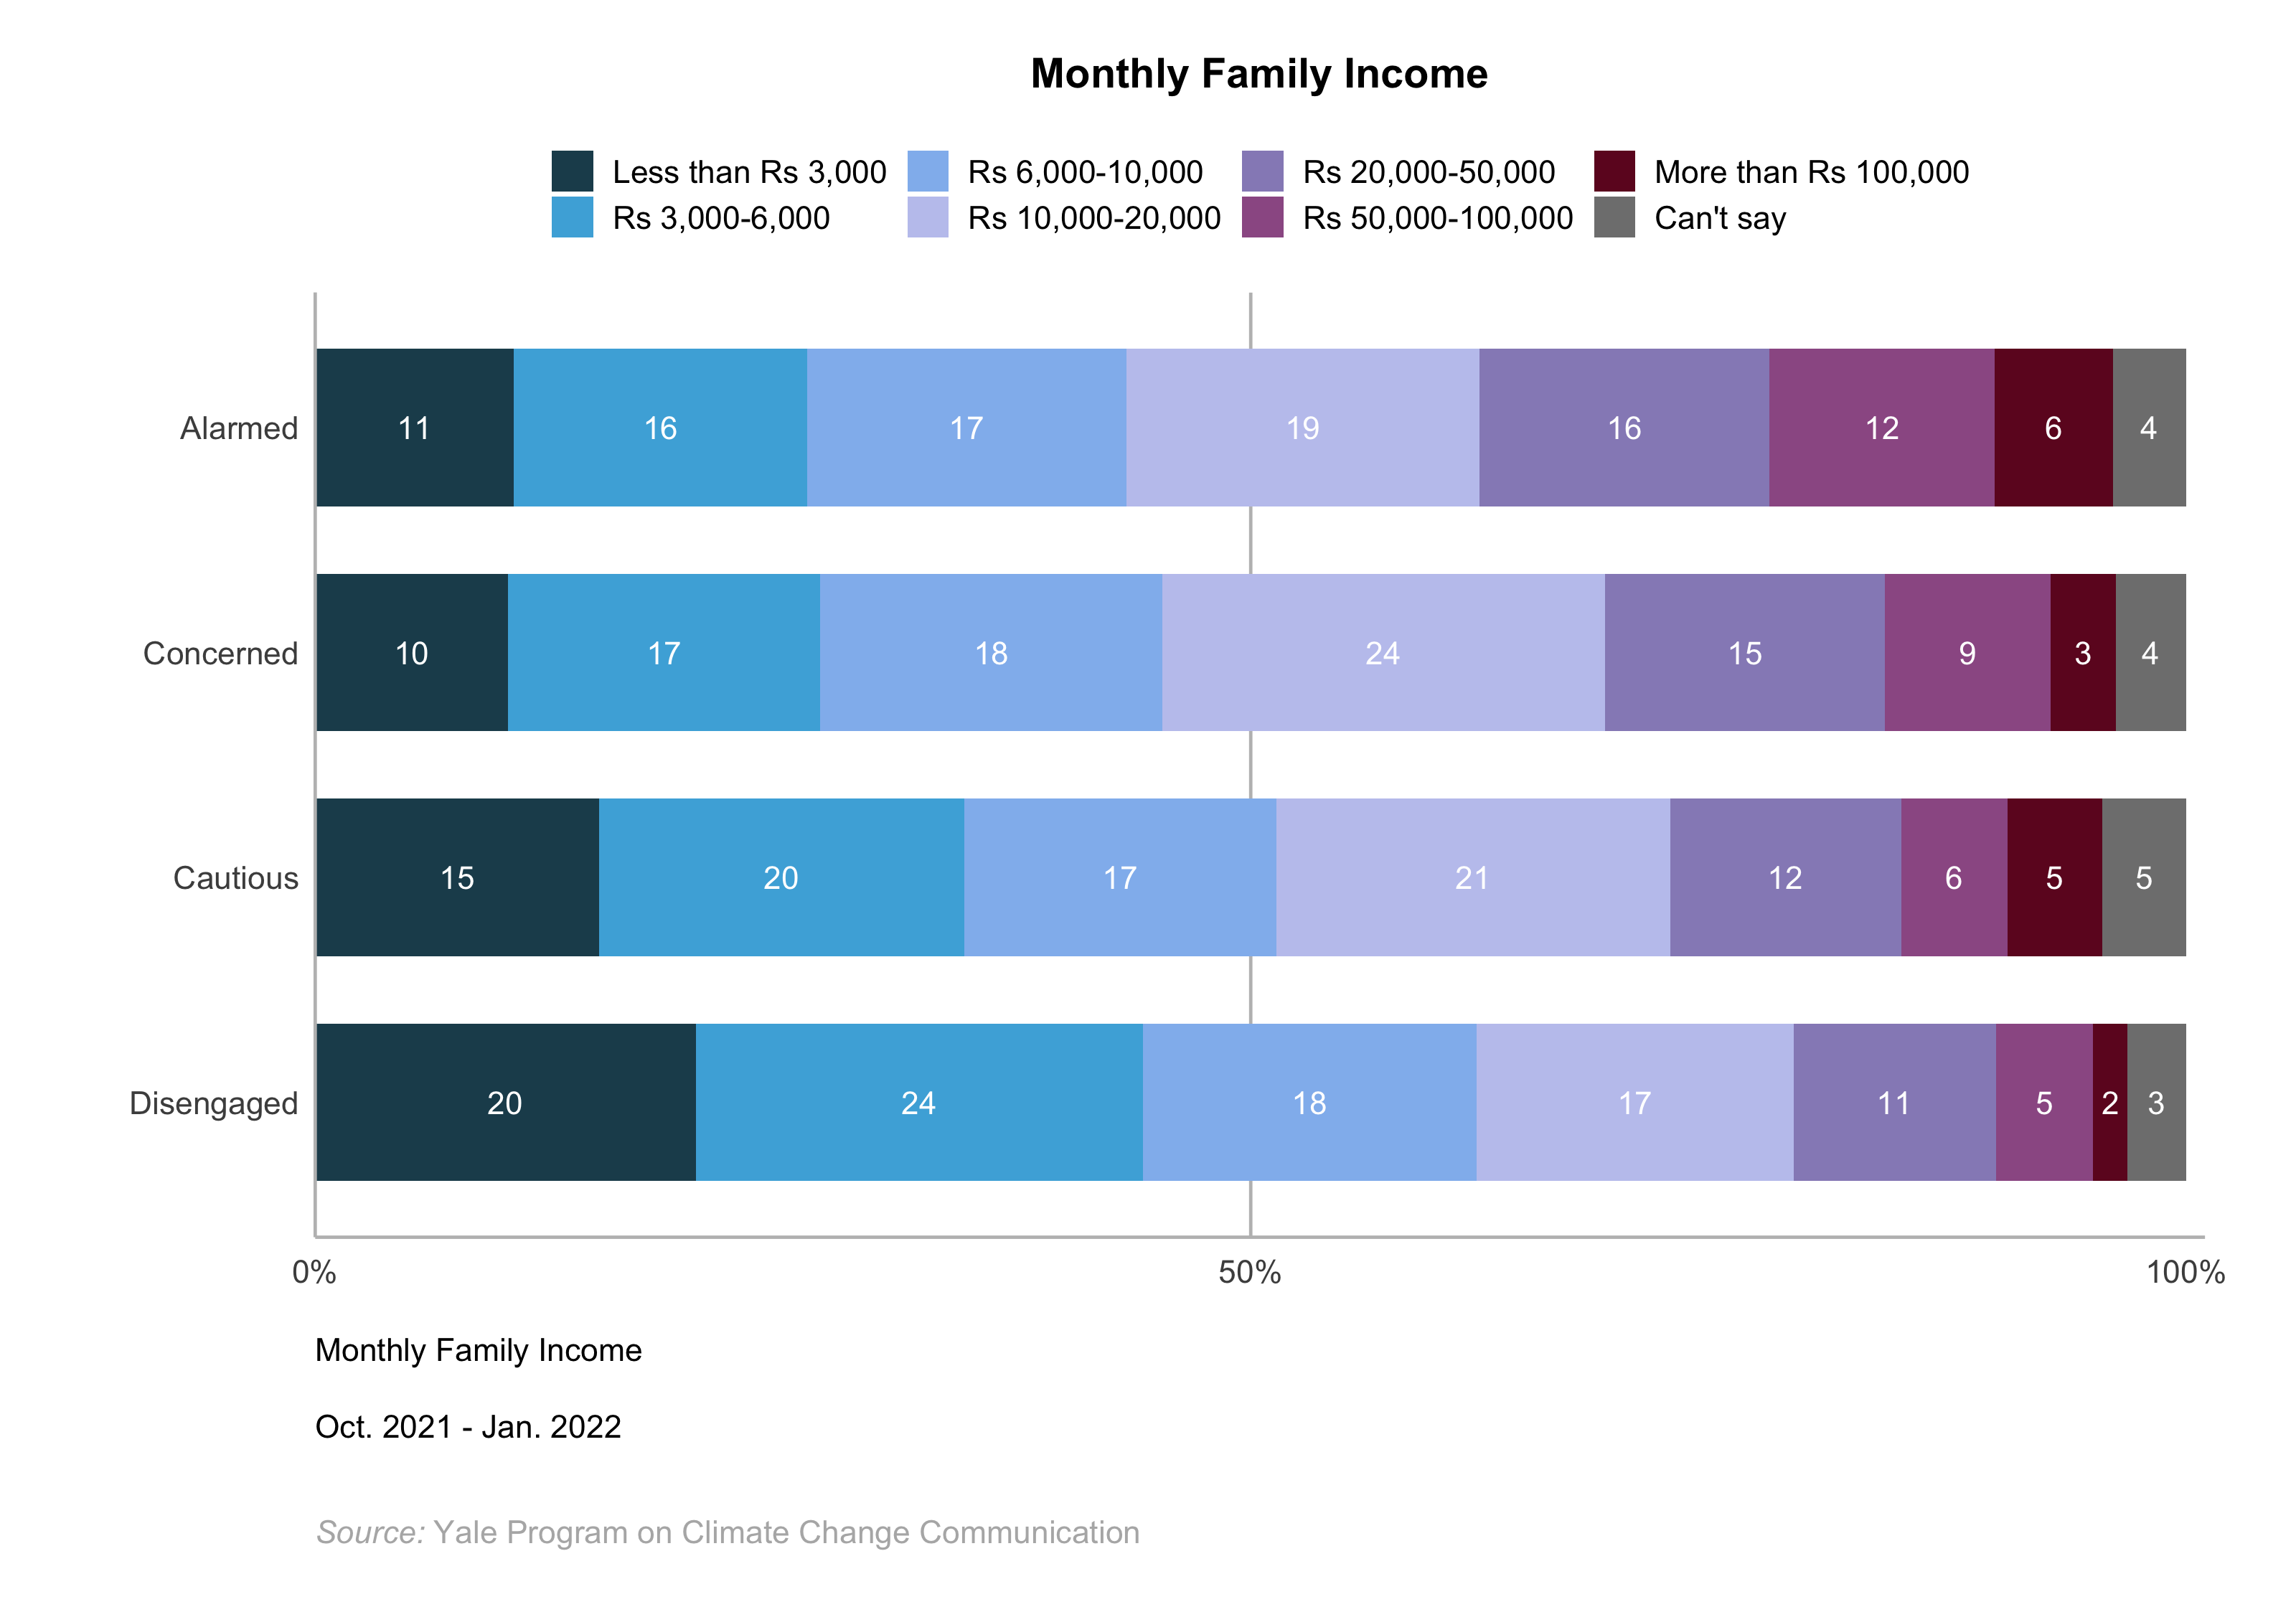
The Alarmed, on average, have the highest levels of education and monthly family income. They are more likely than the other segments to have at least a higher secondary education (41%), while 22% have either primary school education or less. The Alarmed are also the most likely segment to earn a monthly family income of 50,000 Rupees or more (18%), although more than twice as many earn a monthly family income of 10,000 Rupees or less (43%, including 11% who say they earn less than 3,000 Rupees).
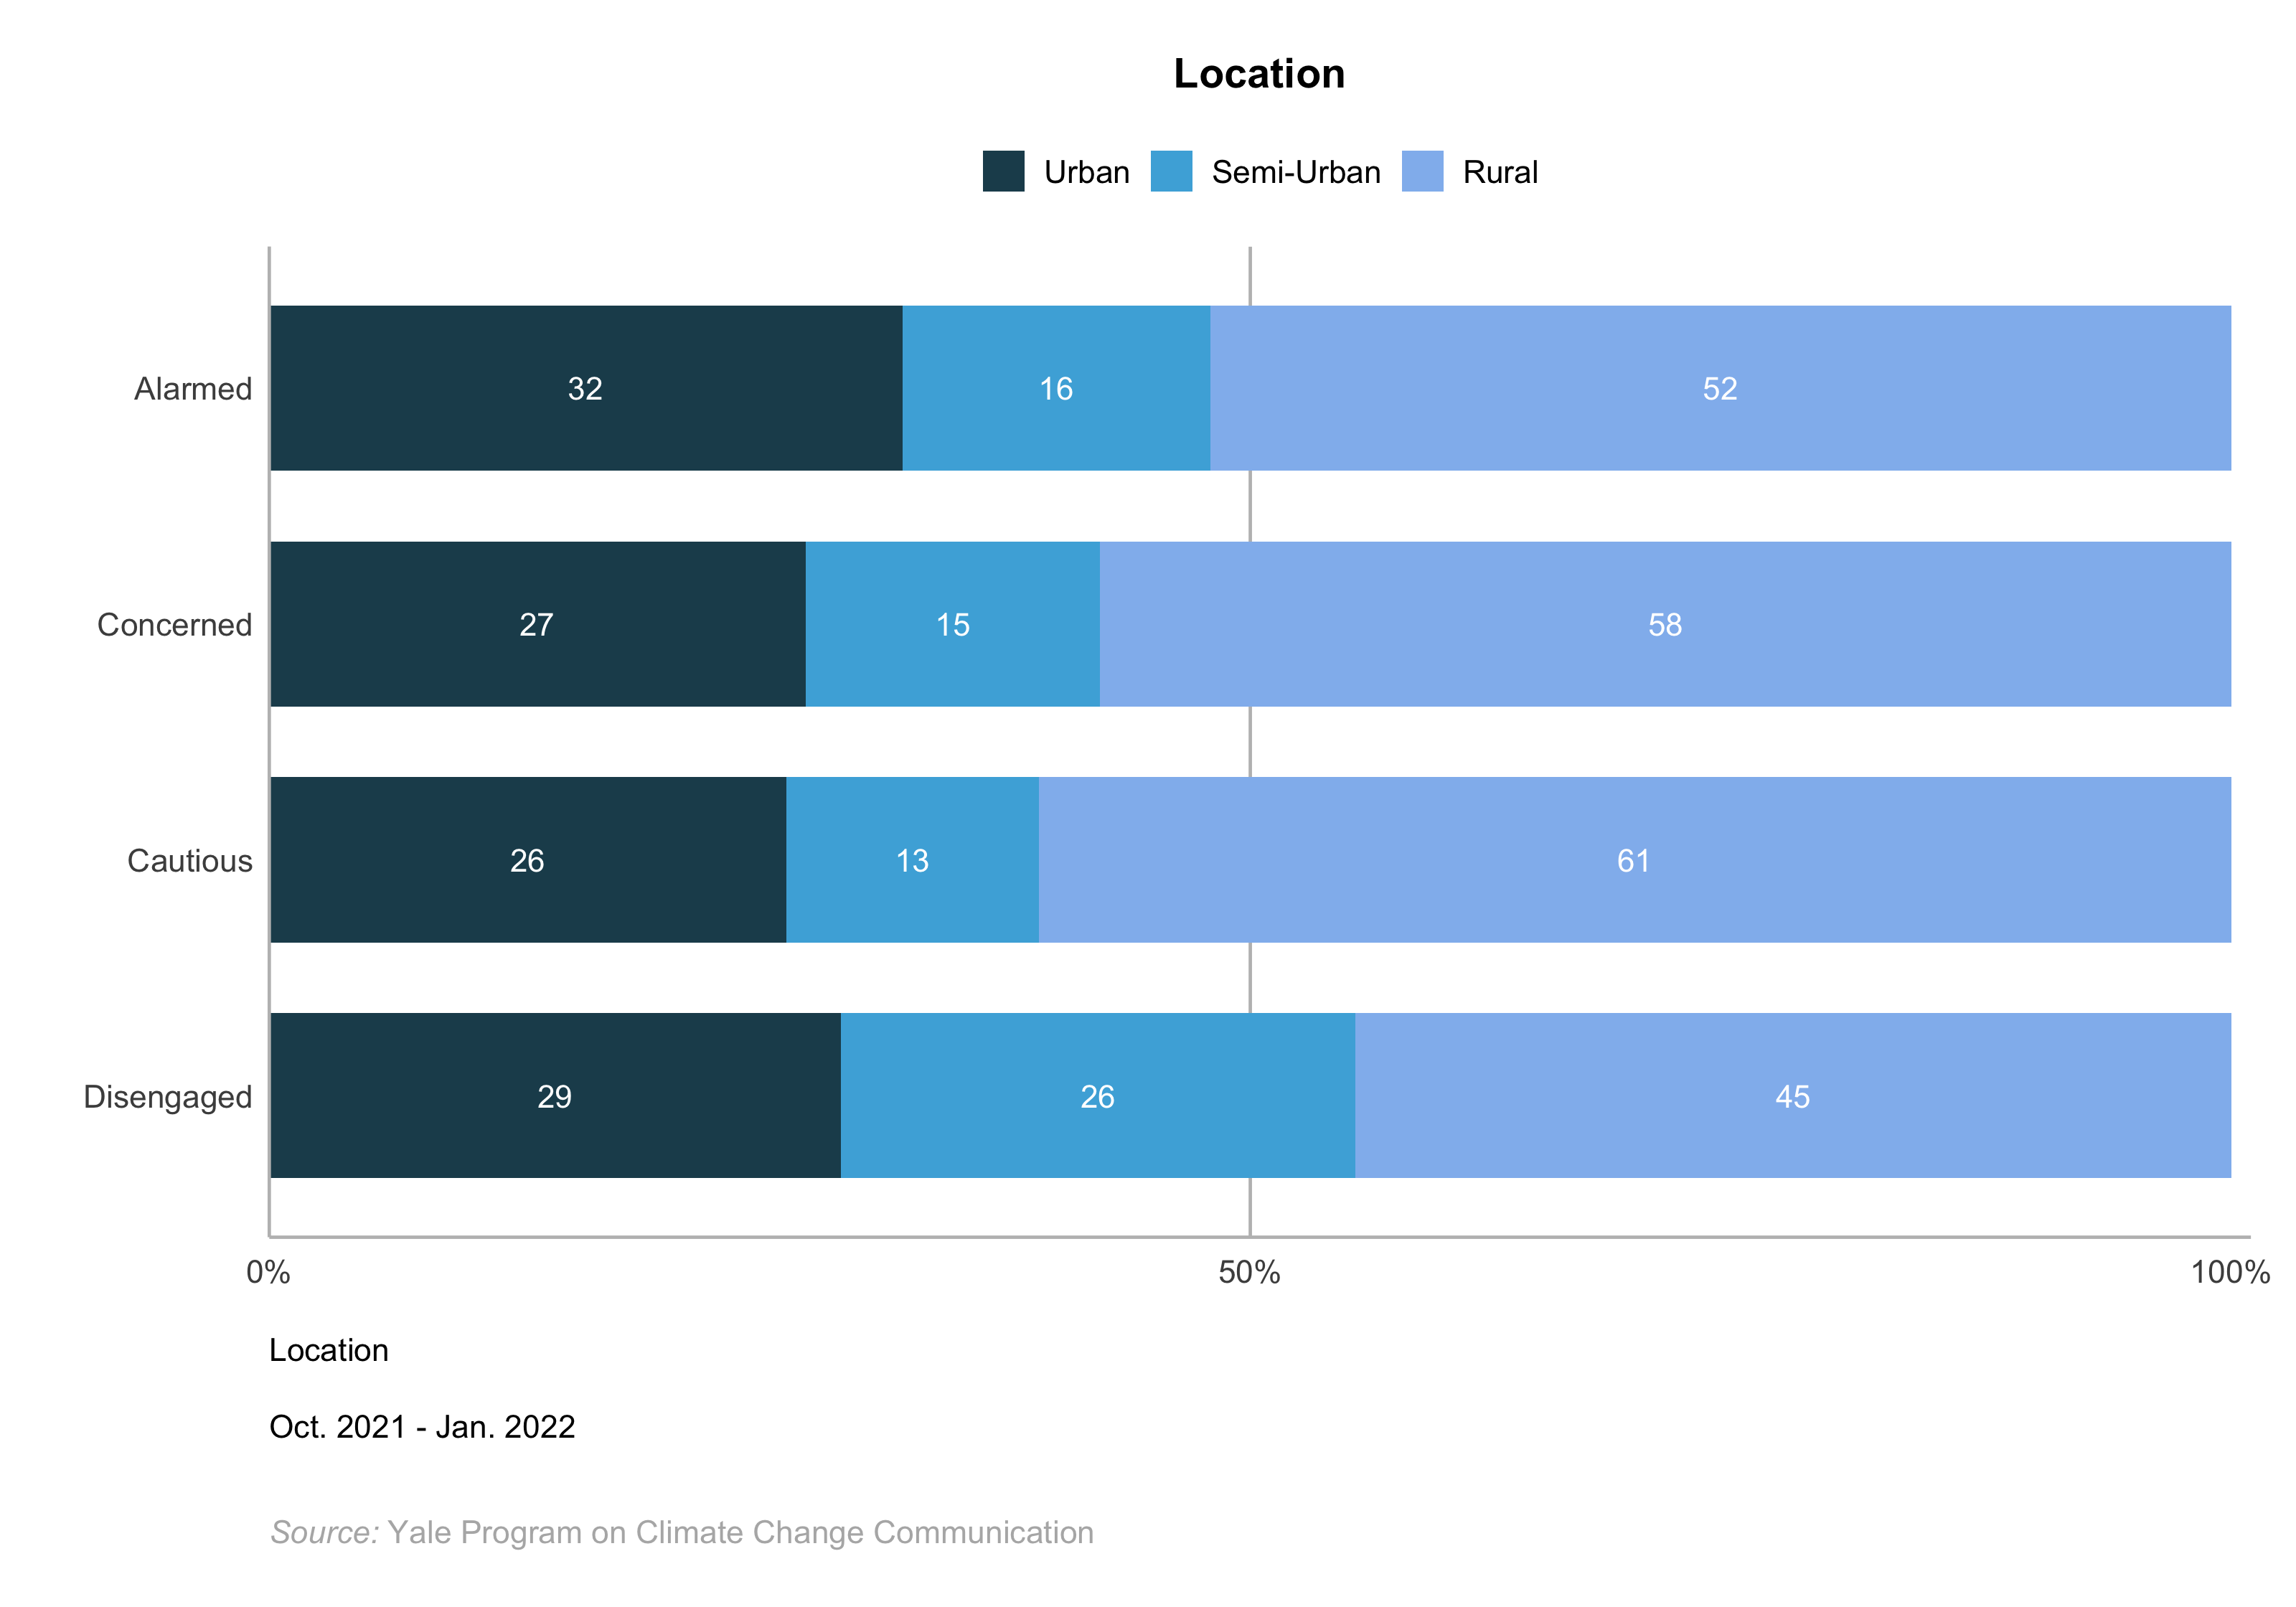
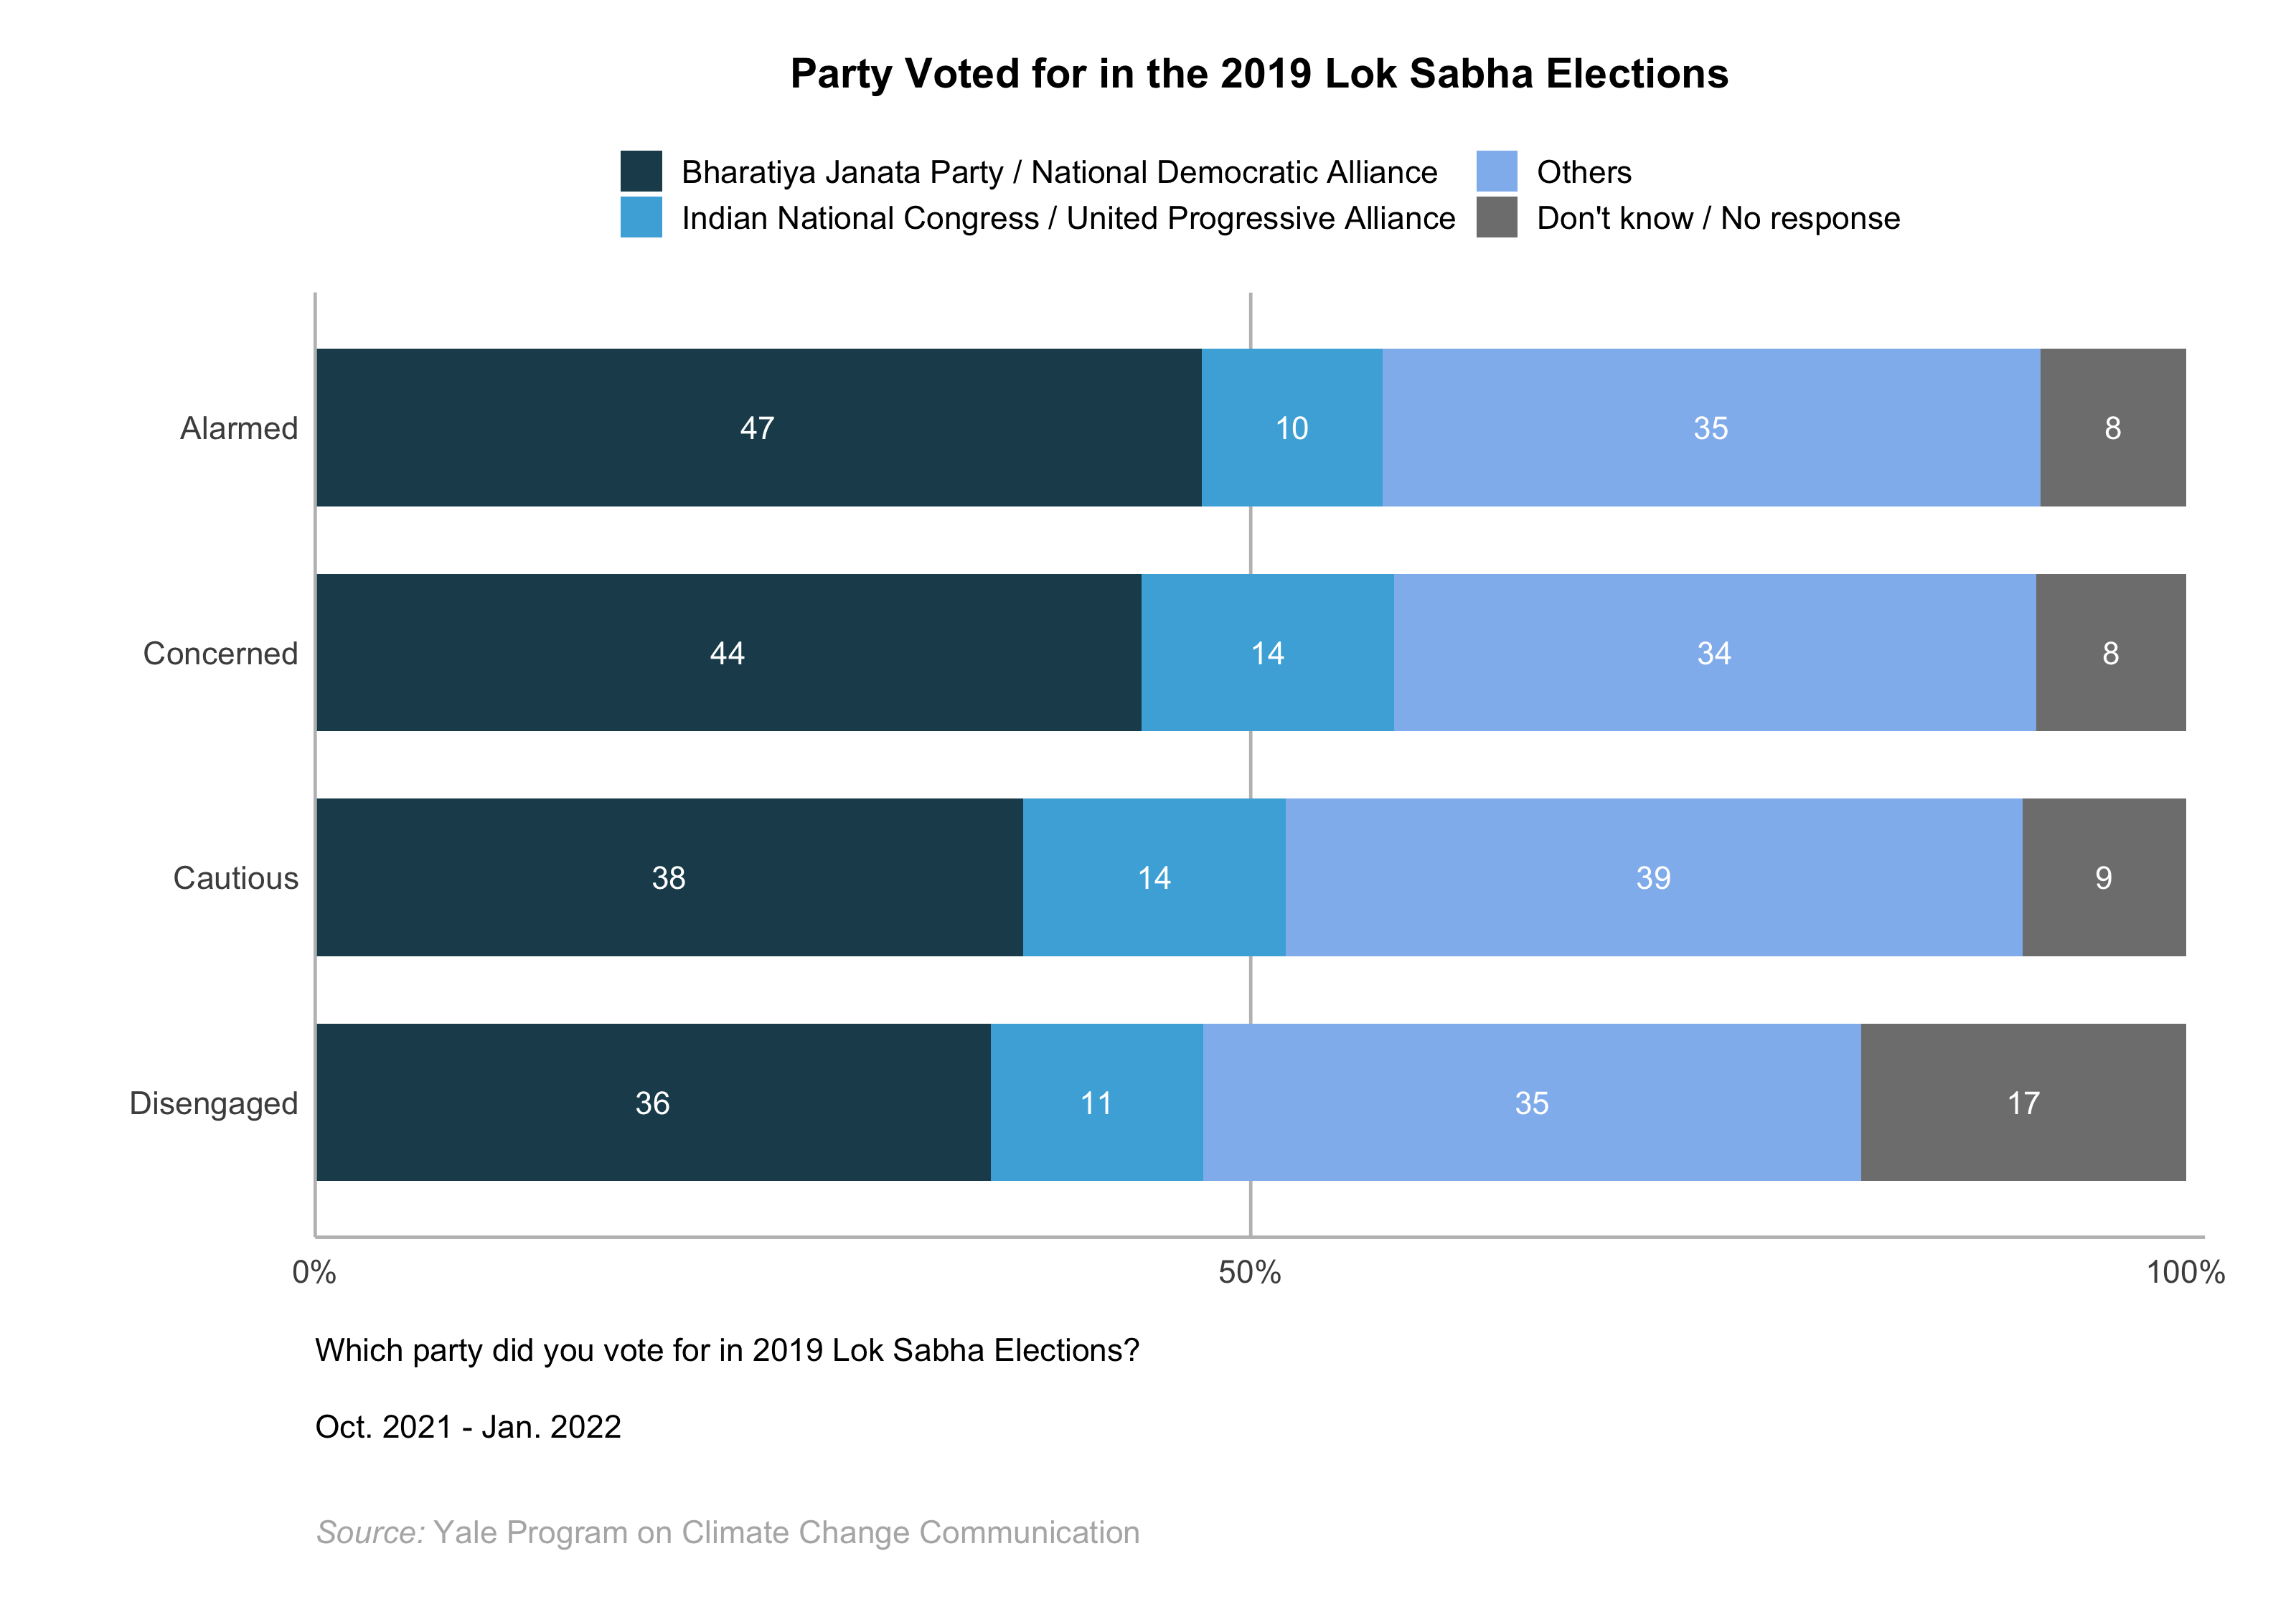
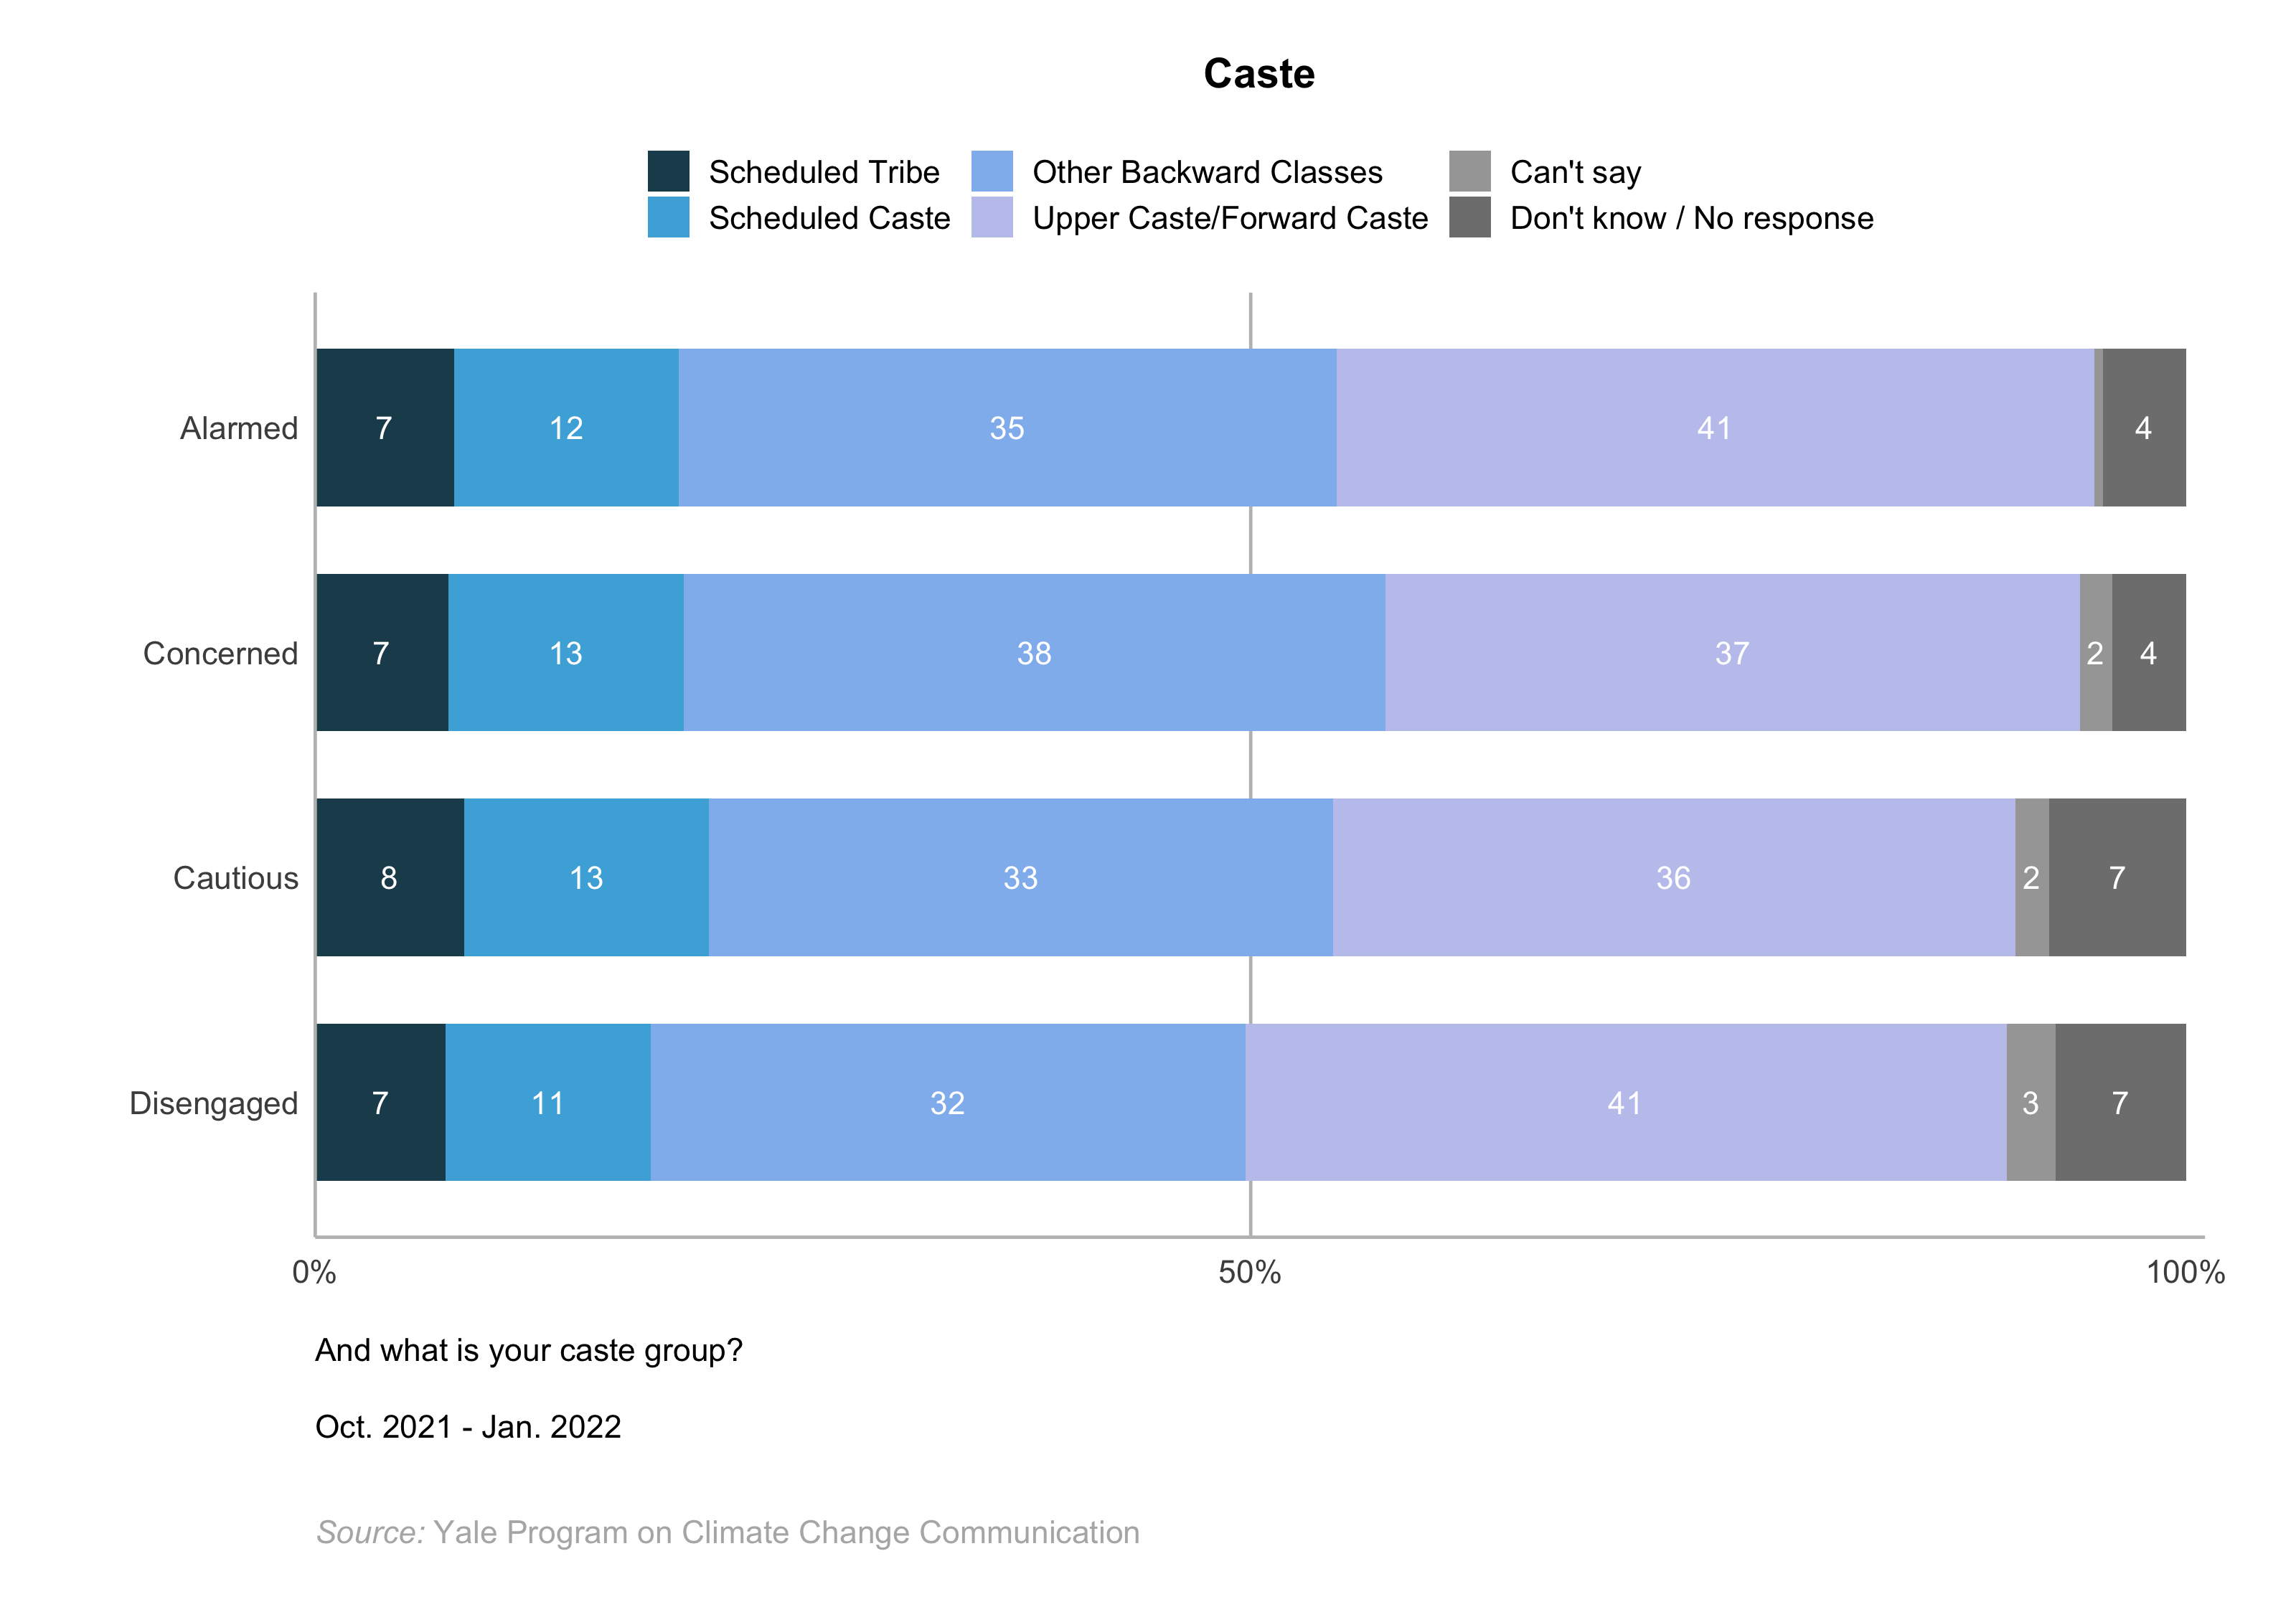
The Alarmed are slightly younger than the other segments – 71% are 18-44 years of age (including 33% who are 18-29), while 29% are 45 or older (including 9% who are 60 or older). The gender breakdown of the Alarmed is similar to the Concerned and Cautious (54% of the Alarmed are male and 46% are female). The Alarmed are more likely than the Concerned and Cautious to live in urban areas (32%) and less likely to live in rural areas (52%). The Alarmed (47%), like the Concerned, are more likely than the other two segments to have voted for the Bharatiya Janata Party/National Democratic Alliance. Most of the Alarmed (80%) are Hindu, and 41% are upper/forward caste.
Concerned
The Concerned, on average, have the second highest levels of education and monthly family income. The Concerned are more likely than the Cautious and Disengaged, but less likely than the Alarmed, to have at least a higher secondary education (29%), while a similar percentage have either a primary education or less (28%). They are also the second most likely segment to earn a monthly family income of 50,000 Rupees or more (12%), although nearly four times as many (45%) earn a monthly family income of 10,000 Rupees or less (including 10% who say they earn less than 3,000 Rupees).
The Concerned are slightly older than the Alarmed – 68% of the Concerned are 18-44 years of age (including 32% who are 18-29), while 32% are 45 or older (including 13% who are 60 or older). The gender breakdown of the Concerned is similar to the Alarmed and Cautious (54% of the Concerned are male and 46% are female). The Concerned are less likely than the Alarmed to live in urban areas (27%) and more likely than the Alarmed and Disengaged to live in rural areas (58%). The Concerned (44%), like the Alarmed, are more likely than the other two segments to have voted for the Bharatiya Janata Party/National Democratic Alliance. Most of the Concerned (81%) are Hindu, and 37% are upper/forward caste.
Cautious
The Cautious, on average, have lower levels of education and monthly family income than do the Alarmed and Concerned. The Cautious are less likely than the Alarmed and Concerned to have at least a higher secondary education (14%) and are more likely to have a primary school education or less (46%), including 8% who are not able to read or write. The Cautious are also less likely than the Alarmed to earn a monthly family income of 50,000 Rupees or more (11%) while they are more likely than the Alarmed and Concerned to earn a monthly family income of 10,000 Rupees or less (51%, including 15% who say they earn less than 3,000 Rupees).
The Cautious, like the Disengaged, are slightly older overall than the Alarmed – 62% are 18-44 years of age (including 29% who are 18-29), while 38% are 45 or older (including 15% who are 60 or older). The gender breakdown of the Cautious is similar to the Alarmed and Concerned (57% of the Cautious are male and 43% are female). Like the Concerned, the Cautious are less likely than the Alarmed to live in urban areas (26%) and are more likely than the Alarmed and Disengaged to live in rural areas (61%). The Cautious (38%) are less likely than the Alarmed and Concerned to have voted for the Bharatiya Janata Party/National Democratic Alliance. The Cautious are less likely to be Hindu (74%) than the other segments, and 36% of the Concerned are upper/forward caste.
Disengaged
The Disengaged, like the Cautious, on average, have lower levels of education and monthly family income than do the Alarmed and Concerned. The Disengaged are less likely than the Alarmed and Concerned to have at least a higher secondary education (21%) and are more likely to have a primary school education or less (51%), including 9% who are not able to read or write. The Disengaged are less likely than the Alarmed and Concerned to earn a monthly family income of 50,000 Rupees or more (7%). Additionally, the Disengaged are the most likely segment to earn a monthly family income of 10,000 Rupees or less (62%, including 20% who say they earn less than 3,000 Rupees).
Like the Cautious, the Disengaged are slightly older overall than are the Alarmed – 63% are 18-44 years of age (including 32% who are 18-29), while 37% are 45 or older (including 11% who are 60 or older). The Disengaged have a much greater proportion of females (76%) than all other segments. They are the most likely of all the segments to live in semi-urban areas (26%) and the least likely to live in rural areas (45%). Similar to the Cautious, the Disengaged (36%) are less likely than the Alarmed and Concerned to have voted for the Bharatiya Janata Party/National Democratic Alliance. Most of the Disengaged (83%) are Hindu, and 41% are upper/forward caste.