Climate Note · Jul 27, 2023
Americans are becoming more worried about extreme heat
By Matthew Ballew, Jennifer Marlon, Seth Rosenthal, Jennifer Carman, John Kotcher, Edward Maibach and Anthony Leiserowitz
Filed under: Beliefs & Attitudes and Climate Impacts

Extreme heat is harming people around the world. So far in 2023, heat waves across three continents in the Northern Hemisphere have already broken records, made many people sick and caused deaths from heat stroke, heat exhaustion, dehydration, or related illnesses – and this extreme heat is likely to continue through August. Earth recently had its hottest June ever recorded, and July will almost certainly break records since global temperatures tend to peak around July 29. Excessive nighttime temperatures – a hallmark of human-caused climate change – makes the heat even more dangerous because it deprives our bodies of a chance to cool down if air conditioning is not available.
Heat waves, known as a “silent killer,” are already the leading cause of weather-related deaths in the U.S. and will intensify in frequency and severity as human-caused climate change increases global temperatures. Last year in Europe – during their hottest summer on record – an estimated 61,600 people died from heat-related causes, indicating that heat preparedness strategies are falling short.
Many Americans are worried about extreme heat and understand it is affected by climate change. In Spring 2023, we found that most Americans (72%) are at least “a little” worried about extreme heat harming their local area – and extreme heat tops the list of worries about climate impacts (e.g., droughts, flooding, water shortages). Additionally, a large majority of Americans (75%) think that global warming is affecting extreme heat at least “a little,” including 42% who say global warming is affecting it “a lot.”
In this analysis, we use data from our Climate Change in the American Mind surveys to assess changes in public levels of worry about extreme heat and other climate impacts over time (spanning March 2018 to April 2023).
Results
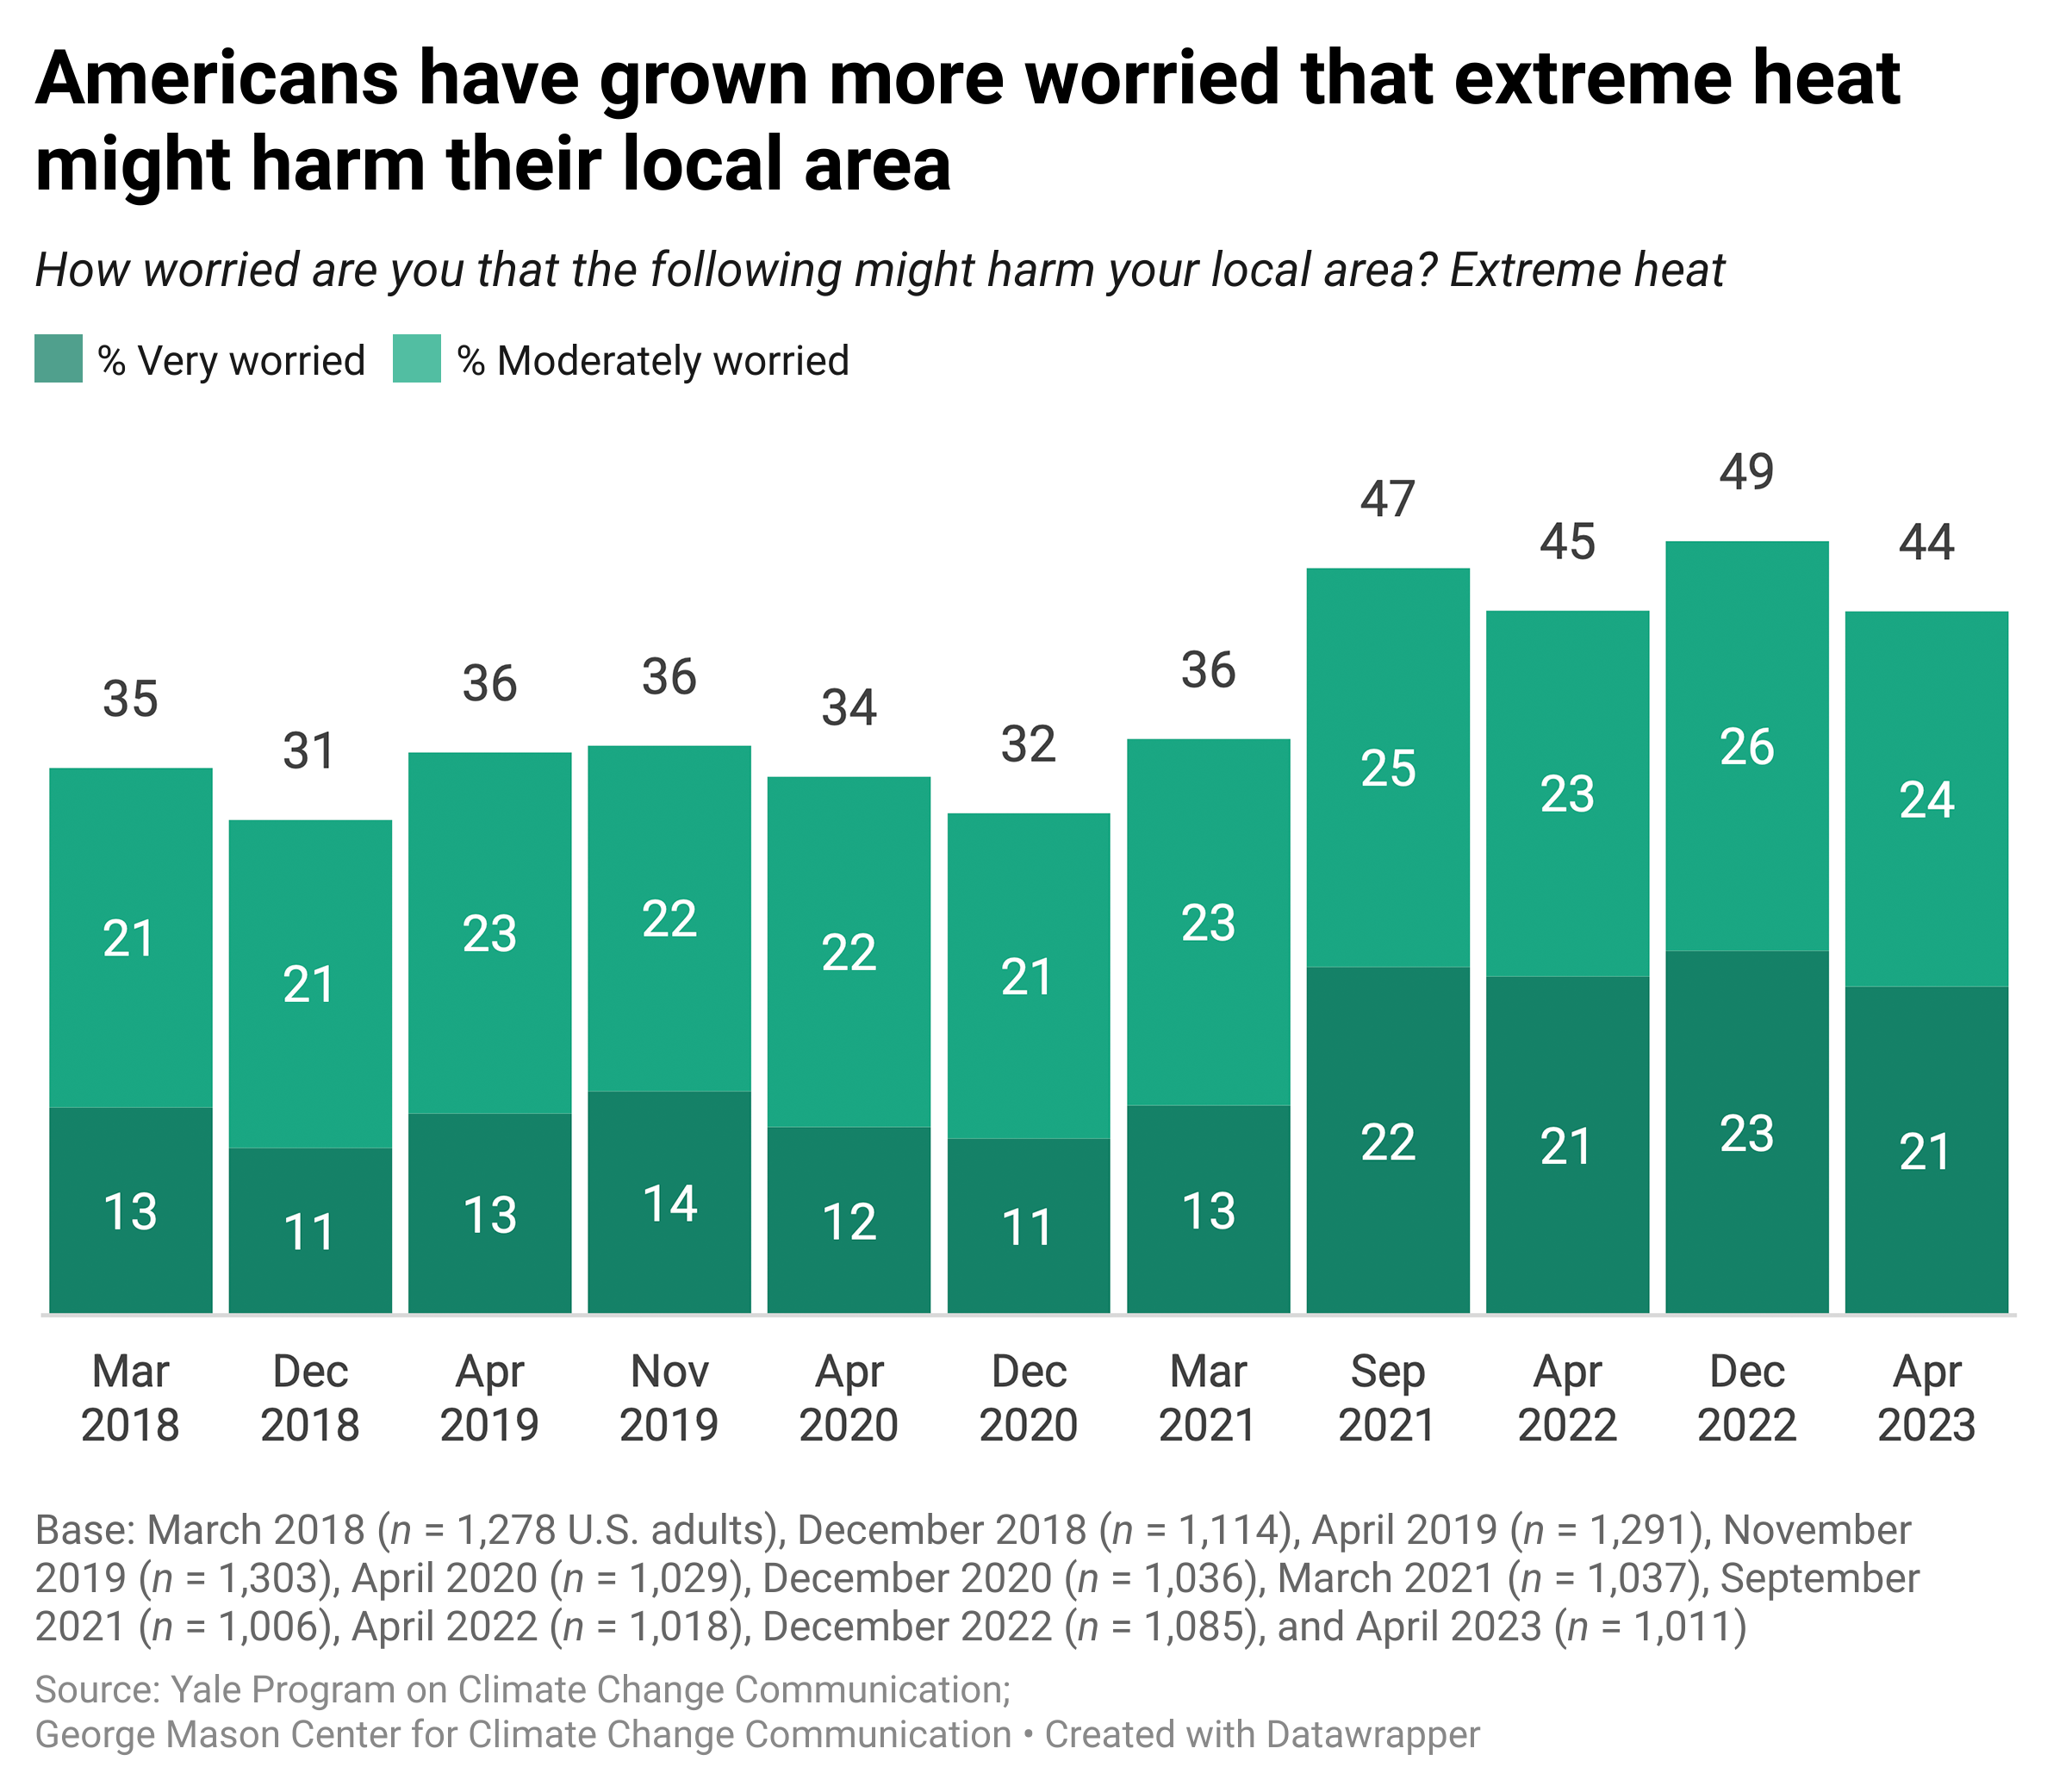
Most Americans (72%) are at least “a little” worried about extreme heat, including 44% who are either “very” or “moderately” worried. Over the past five years, Americans have grown more worried that extreme heat might harm their local area, increasing +9 percentage points from 35% in March 2018 (13% “very;” 21% “moderately”) to 44% in April 2023 (21% “very;” 24% “moderately”).Percentage points are rounded to the nearest whole number for tabulation purposes and summed categories (e.g., “Very worried” + “Moderately worried”) are rounded after sums are calculated (e.g., 13.12% + 21.48% = 34.60%, which after rounding would appear in this report as 13% + 21% = 35%). The percentage of Americans who are “very” worried about extreme heat harming their local area has also increased over time (+8 points).
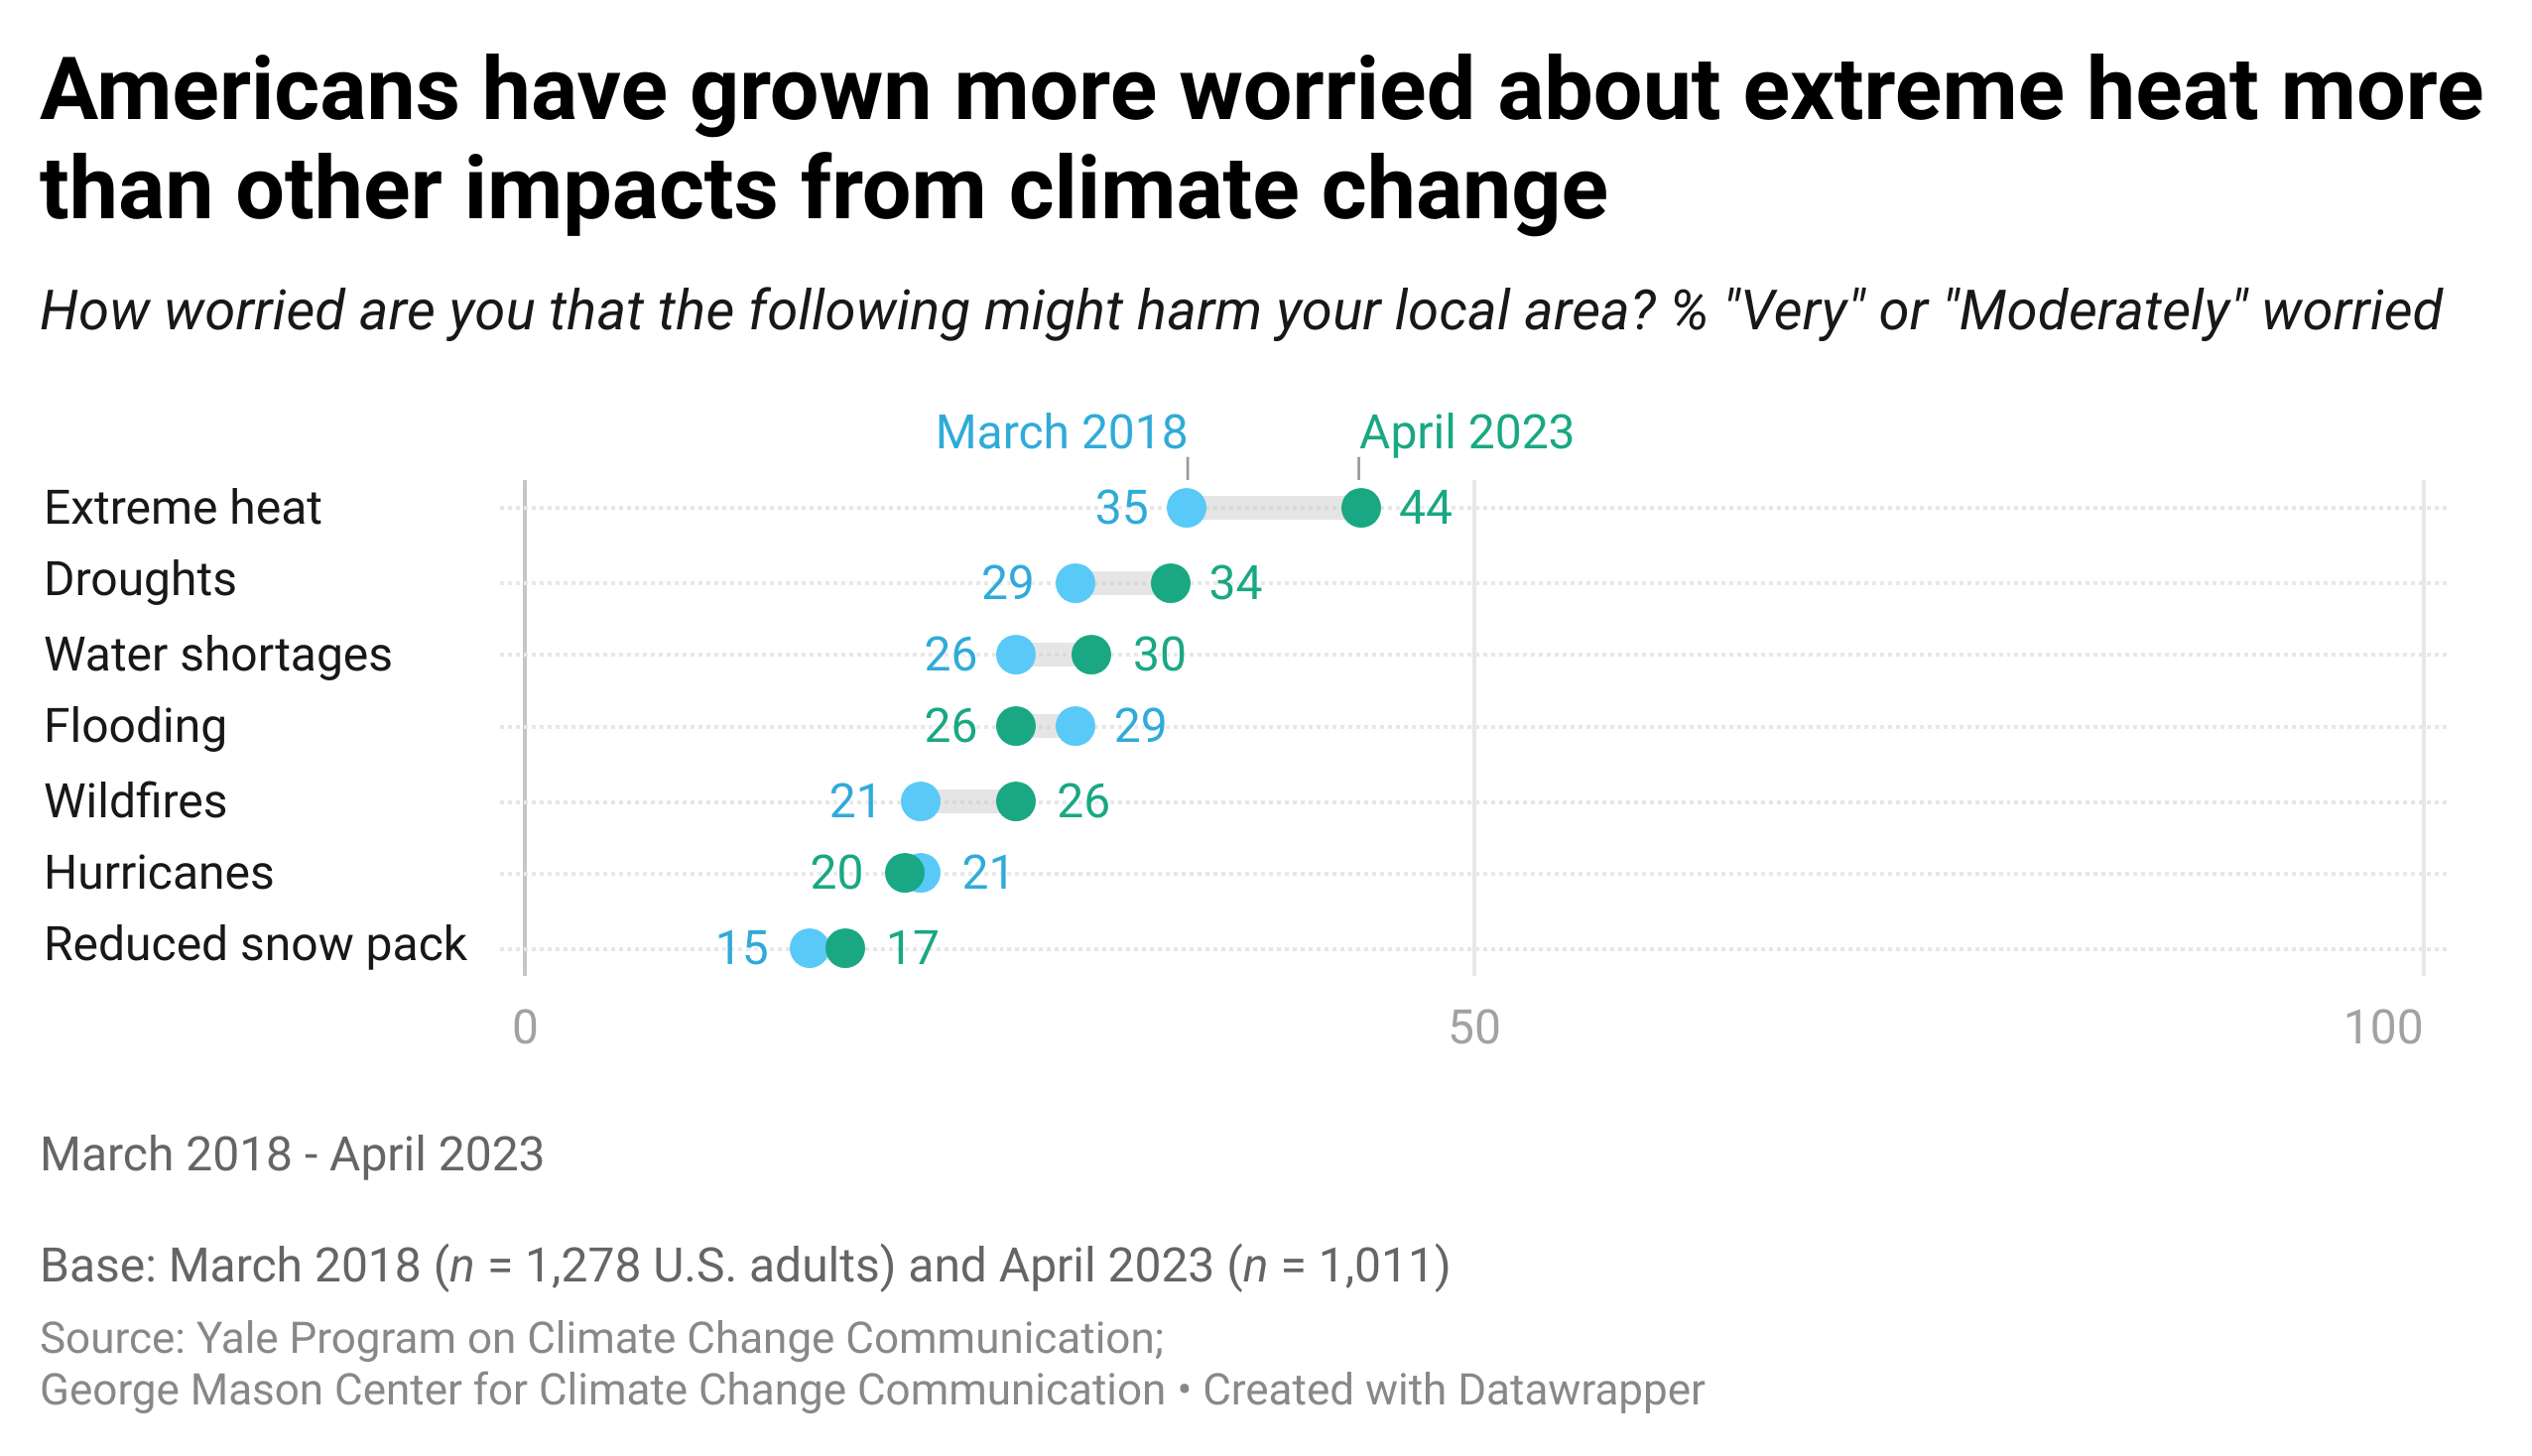
Additionally, Americans have grown more worried about extreme heat (+9 points since March 2018) than other climate impacts, including wildfires (+5 points), droughts (+5 points), water shortages (+4 points), reduced snow pack (+2 points), hurricanes (-1 points), and flooding (-3 points).
Importantly, the surveys reported here were all conducted before this summer’s extreme heat waves. Worry about extreme heat may be further increasing right now.
It is important for communicators to emphasize the connection between climate change and extreme weather events (e.g., heat waves, wildfires) and how these events directly impact people’s health, the economy, and public infrastructure. Experience with climate impacts can be a powerful teacher. Personal experience and hearing about others’ experiences with global warming can shape people’s climate beliefs. Research also indicates that hot, dry days have been more likely than other extreme weather events to cause people to say they have experienced global warming.
As the frequency and severity of extreme heat increases, it is important to provide the public with health resources to protect against heat waves – and to reduce the burning of fossil fuels that emit carbon pollution, trap heat, and cause global warming. It is also vital to check on family, friends, and neighbors, especially as heat waves worsen and surprise people unaccustomed to these extremes.
Methods
The results of this report are based on 2018-2023 data from 11 waves of the Climate Change in the American Mind survey – a biannual nationally representative survey of U.S. public opinion on climate change conducted jointly by the Yale Program on Climate Change Communication and the George Mason University Center for Climate Change Communication. Data were collected in March 2018 (n = 1,278), December 2018 (n = 1,114), April 2019 (n = 1,291), November 2019 (n = 1,303), April 2020 (n = 1,029), December 2020 (n = 1,036), March 2021 (n = 1,037), September 2021 (n = 1,006), April 2022 (n = 1,018), December 2022 (n = 1,085), and April 2023 (n = 1,011). Survey data were collected using the Ipsos KnowledgePanel®, a representative online panel of U.S. adults ages 18 and older. Respondents self-administered the questionnaires online in a web-based environment.
The question “How worried are you that the following might harm your local area?” was first asked to respondents in March 2018 and included the seven environmental problems used in the present analysis.
Data for each survey wave were weighted to align with demographic parameters in the United States. In figures/data tables, bases specified are unweighted, while percentages are weighted to match national population parameters. For tabulation purposes, percentage points are rounded to the nearest whole number. As a result, summed categories (e.g., “Very worried” + “Moderately worried”) are rounded after sums are calculated (e.g., 13.12% + 21.48% = 34.60%, which after rounding would appear in this report as 13% + 21% = 35%). The average margin of error is +/- 3 percentage points at the 95% confidence interval for each sample of U.S. adults. The data tables used to develop the charts/figures can be found here.