Climate Note · Nov 16, 2023
How many Americans want an electric home?
By Jennifer Marlon, Matto Mildenberger, Carla Burns, Sarah Lazarovic, Matthew Ballew, Seth Rosenthal, Edward Maibach, John Kotcher and Anthony Leiserowitz
Filed under: Audiences, Beliefs & Attitudes, Policy & Politics and Behaviors & Actions

The shift away from fossil fuels and towards renewable energy sources like solar and wind is already well underway. Solar panels and wind turbines are being installed to provide electricity. This electricity can be stored in batteries or directly used to power factories, vehicles, and appliances like heating and cooling systems, clothes dryers, stoves, water heaters, and refrigerators. The process of replacing fossil fuel-reliant infrastructure with machines that use electric power from renewable energy sources is often termed “electrification,” and the faster we “electrify everything,” the less carbon pollution we will emit, reducing climate change and health and environmental impacts.
According to data from nonprofit Rewiring America, we have to install 24,000,000 more electrified machines than we are currently on pace to install over the next three years to be on track to meet our climate goals by 2050. It’s an extraordinarily ambitious goal and it’s absolutely possible – but it depends heavily on Americans’ preferences, motivations, and abilities to make the transition, and the marketplace’s ability to respond.
In our most recent nationally representative Climate Change in the American Mind survey (conducted April 18 – May 1, 2023), we collaborated with Rewiring America and the 2035 Initiative at the University of California Santa Barbara to ask Americans whether they would prefer a home with appliances powered by fossil fuels or by electricity, assuming costs and other features were the same (see the chart for full question text). We found that about three in ten (31%) Americans prefer a home in which all major appliances (stove, heating system, water heater, etc.) are powered by electricity and an additional 29% prefer a home in which most major appliances are powered by electricity, but which has a gas stove for cooking. About one in five Americans (21%) said they prefer a home in which most or all major appliances are powered by fossil fuels, such as natural gas, propane, or oil. About one in five Americans (19%) said they have no preference or don’t know.
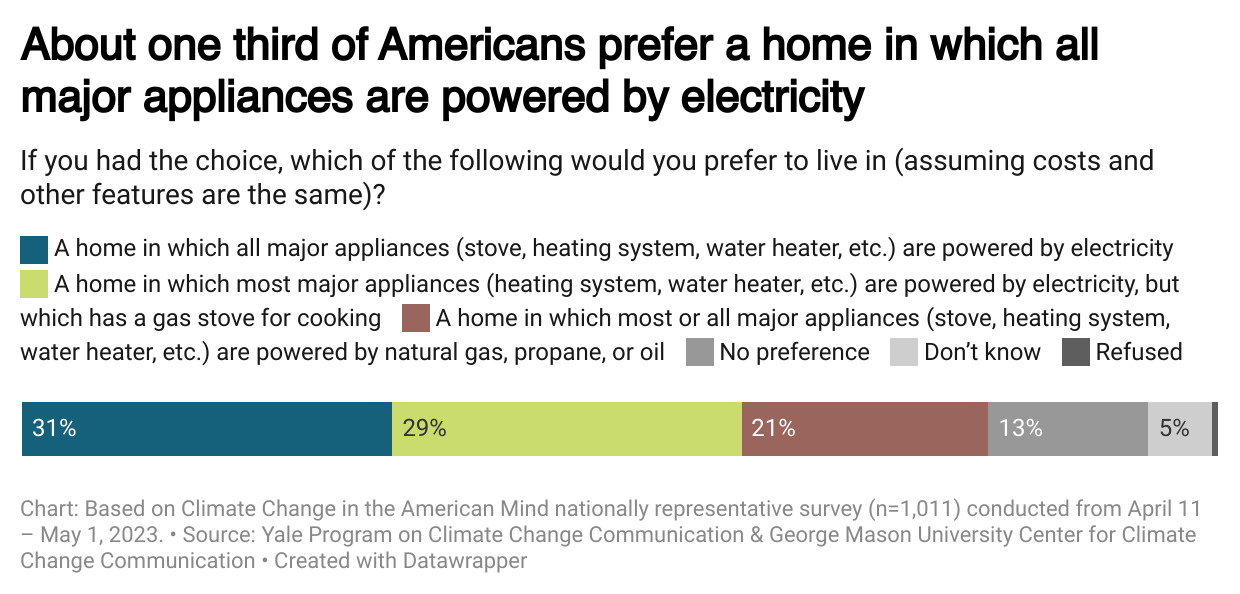
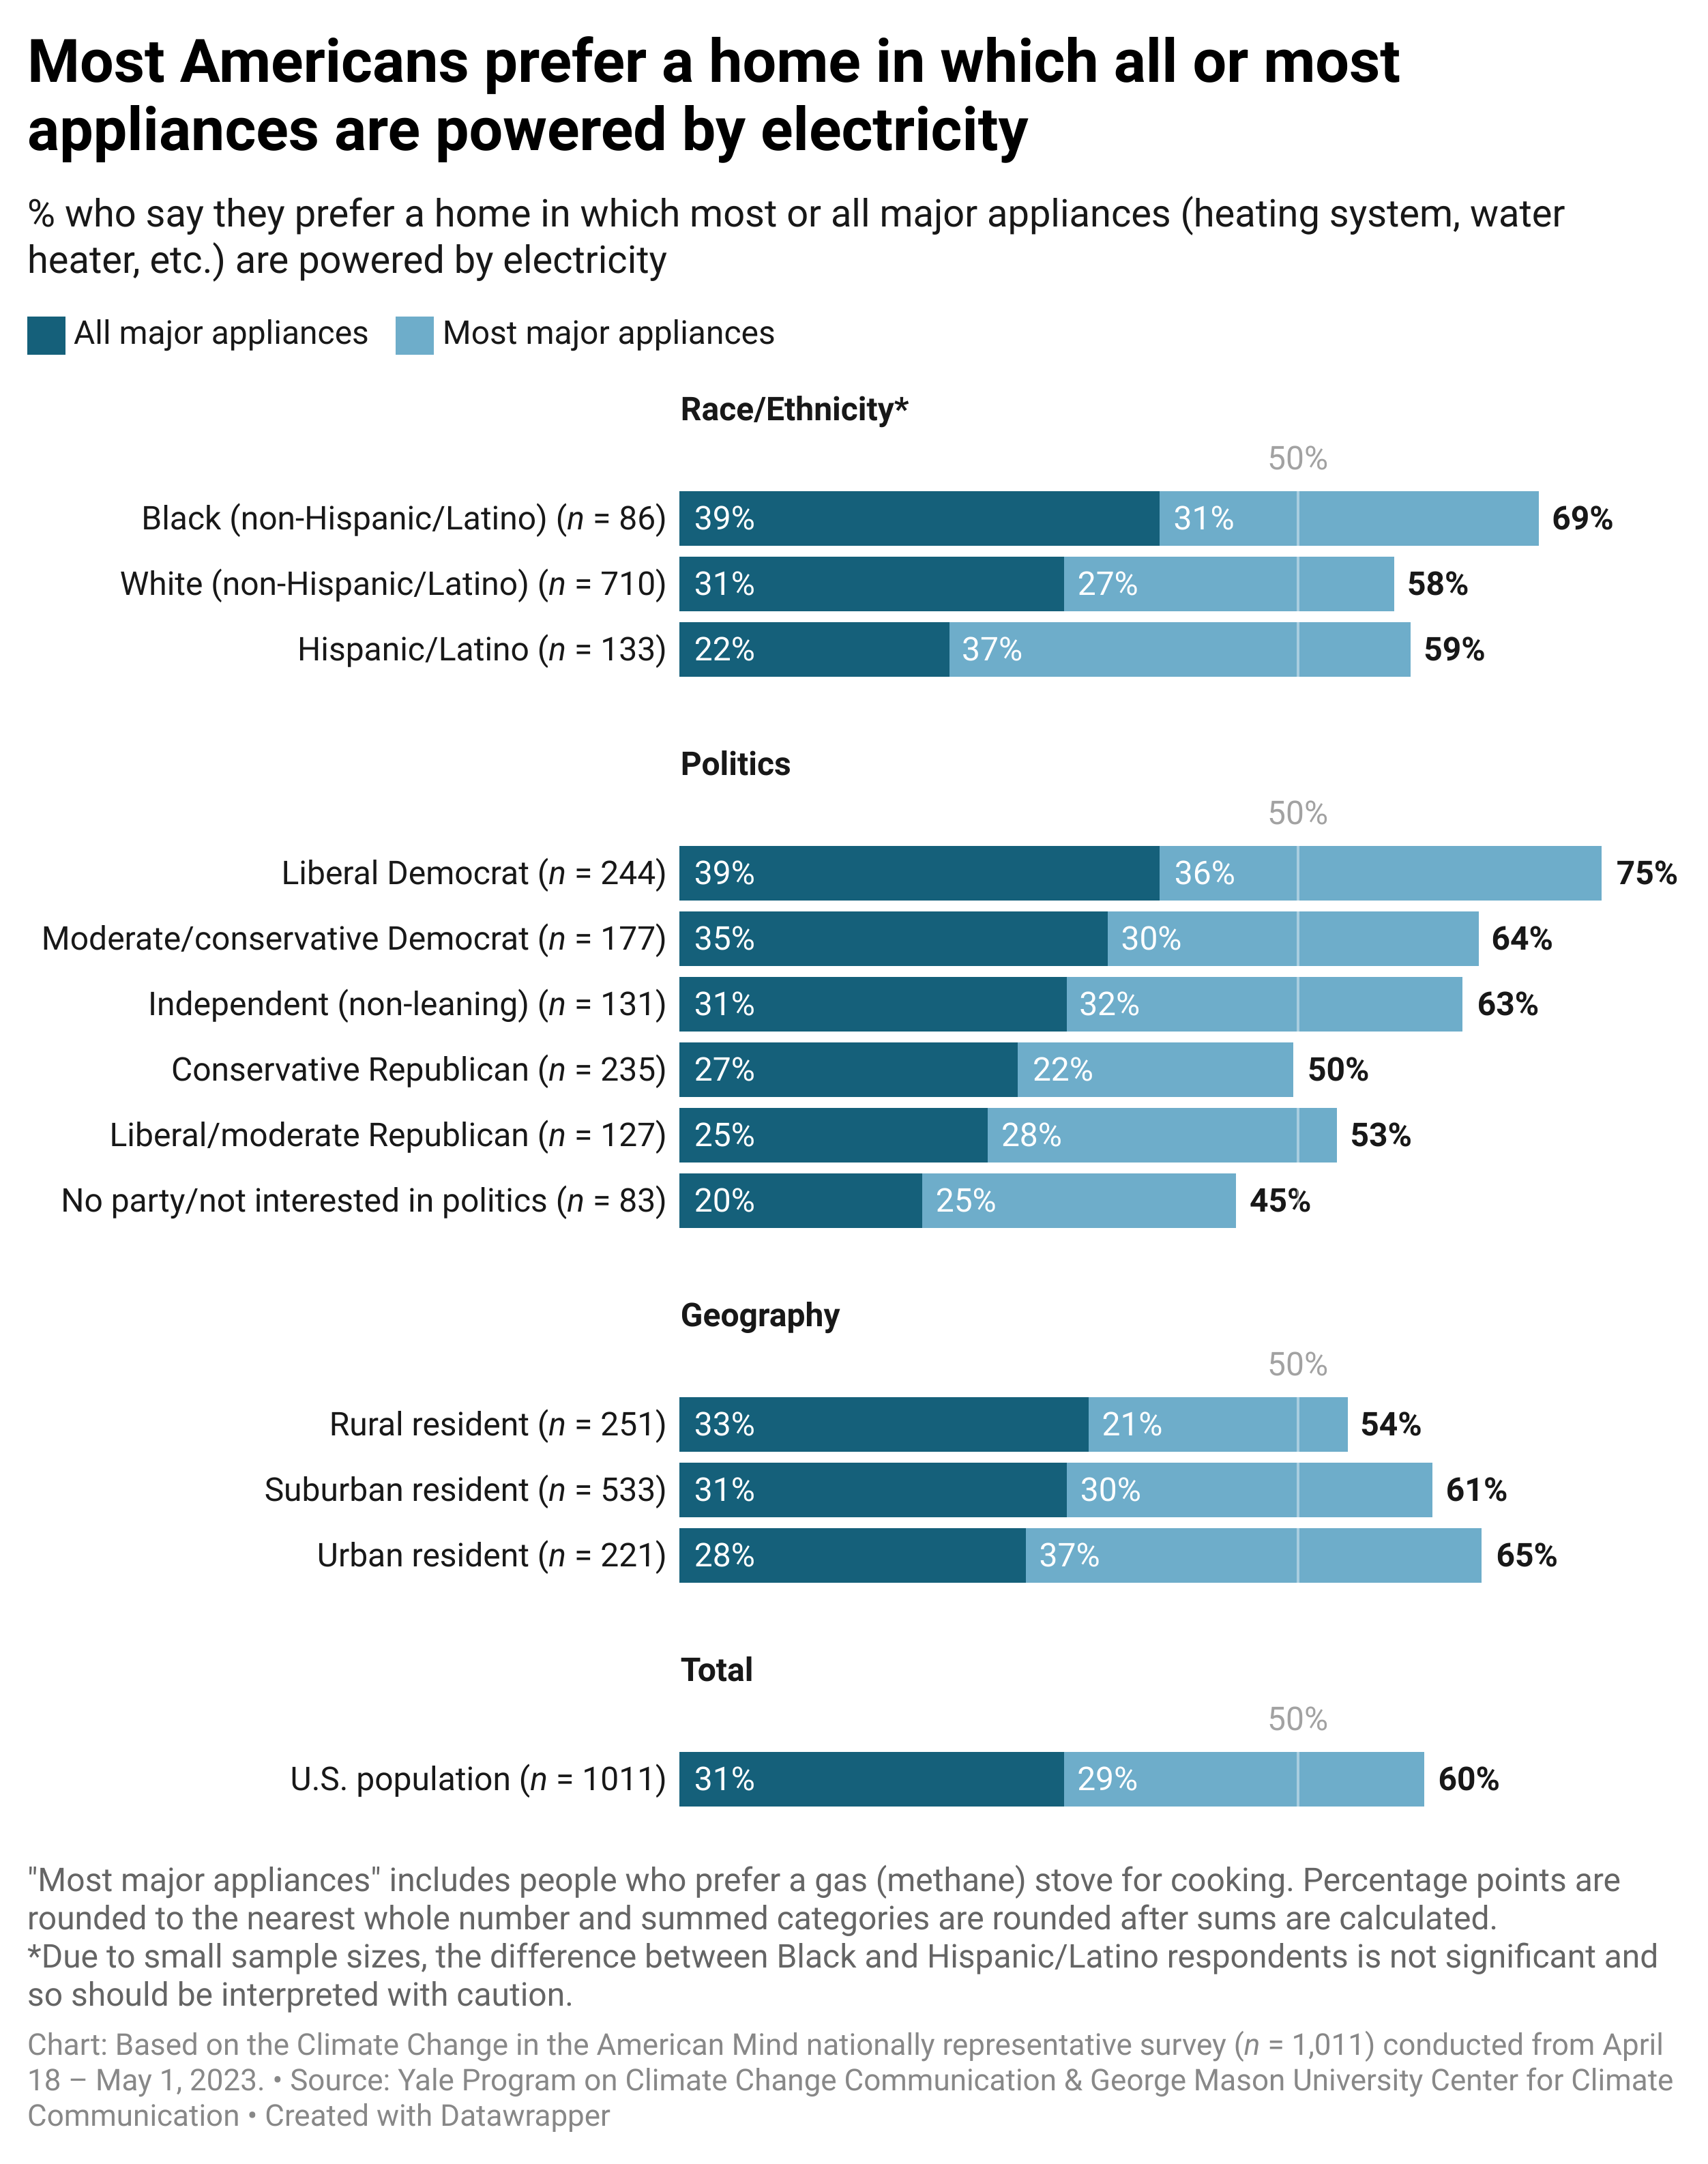
Taken together, a majority (60%) prefer a home in which all or most major appliances are powered by electricity.For tabulation purposes, percentage points are rounded to the nearest whole number and summed categories (e.g., “all major appliances” + “most major appliances”) are rounded after sums are calculated (e.g., 38.8% + 30.6% = 69.4%, which after rounding would appear in this report as 39% + 31% = 69%). But preferences vary across political, racial/ethnic, and geographic groups. Political affiliation is associated with preferences for electric appliances, with Democrats preferring them more often than Republicans. For example, most liberal Democrats (75%) say they prefer an all or mostly electric home, while about half of conservative Republicans (50%) say so. Black respondents (69%) are more likely than Hispanic/Latino (59%) and White respondents (58%) to prefer all or mostly electric homes, whereas rural residents (54%) are somewhat less likely than suburban (61%) and urban (65%) residents to prefer them.
While the gas industry pays Instagram influencers to endorse gas stoves, scientists continue to find evidence of serious health harms from burning methane gas to cook food. As of 2021, fossil fuels power 41% of cooking stoves in US homes.
This research was conducted in collaboration with Carla Burns and Sarah Lazarovic of Rewiring America. We are deeply grateful for their time and insights.
Methods
The results of this report are based on data from the Spring 2023 wave (n = 1,011) of the biannual Climate Change in the American Mind survey – a nationally representative survey of U.S. public opinion on climate change conducted by the Yale Program on Climate Change Communication and the George Mason University Center for Climate Change Communication. Data were collected from April 18 to May 1, 2023 using the Ipsos KnowledgePanel®, a representative online panel of U.S. adults ages 18 and older. Questionnaires were self-administered online in a web-based environment.
Data were weighted to align with demographic parameters in the United States. In figures/data tables, bases specified are unweighted, while percentages are weighted to match national population parameters. For tabulation purposes, percentage points are rounded to the nearest whole number and summed categories (e.g., “all major appliances” + “most major appliances”) are rounded after sums are calculated (e.g., 38.8% + 30.6% = 69.4%, which after rounding would appear in this report as 39% + 31% = 69%).
Due to sample size limitations among racial/ethnic groups, we can only compare the three largest racial/ethnic groups in the U.S.: White (non-Hispanic/Latino), Black (non-Hispanic/Latino), and Hispanic/Latino adults.
The average margin of error is +/- 3 percentage points at the 95% confidence interval for the full sample of U.S. adults (n = 1,011). Average margins of error for subgroups are as follows: +/- 10.6 percentage points for Black (non-Hispanic/Latino) respondents (n = 86), +/- 3.7 for White (non-Hispanic/Latino) respondents (n = 710), +/- 8.5 for Hispanic/Latino respondents (n = 133), +/- 6.3 for liberal Democrats (n = 244), +/- 7.4 for moderate/conservative Democrats (n = 177), +/- 8.6 for Independents (n = 131), +/- 8.7 for liberal/moderate Republicans (n = 127), +/- 6.4 for conservative Republicans (n = 235), +/- 6.2 for rural residents (n = 251), +/- 4.2 for suburban residents (n = 533), and +/- 6.6 for urban residents (n = 221).