Climate Note · Dec 14, 2018
The Green New Deal has Strong Bipartisan Support
By Abel Gustafson, Seth Rosenthal, Anthony Leiserowitz, Edward Maibach, John Kotcher, Matthew Ballew and Matthew Goldberg
Filed under: Policy & Politics

The Green New Deal has Strong Bipartisan Support among Registered Voters
Some members of Congress are proposing a “Green New Deal” for the U.S. They say that a Green New Deal will produce jobs and strengthen America’s economy by accelerating the transition from fossil fuels to clean, renewable energy. The Deal would generate 100% of the nation’s electricity from clean, renewable sources within the next 10 years; upgrade the nation’s energy grid, buildings, and transportation infrastructure; increase energy efficiency; invest in green technology research and development; and provide training for jobs in the new green economy.
While the Green New Deal has been a fixture of the post-election news cycle, and at least 40 members of Congress (to date) have endorsed the idea, little is known about the American public’s support for or opposition to it. To inform this question, we surveyed a nationally-representative sample of registered voters in the United States.
In the survey, we showed respondents a brief description of the Green New Deal, which was identical to the first paragraph of this report (above). The description was followed by the question “How much do you support or oppose this idea?”
The survey results show overwhelming support for the Green New Deal, with 81% of registered voters saying they either “strongly support” (40%) or “somewhat support” (41%) this plan.
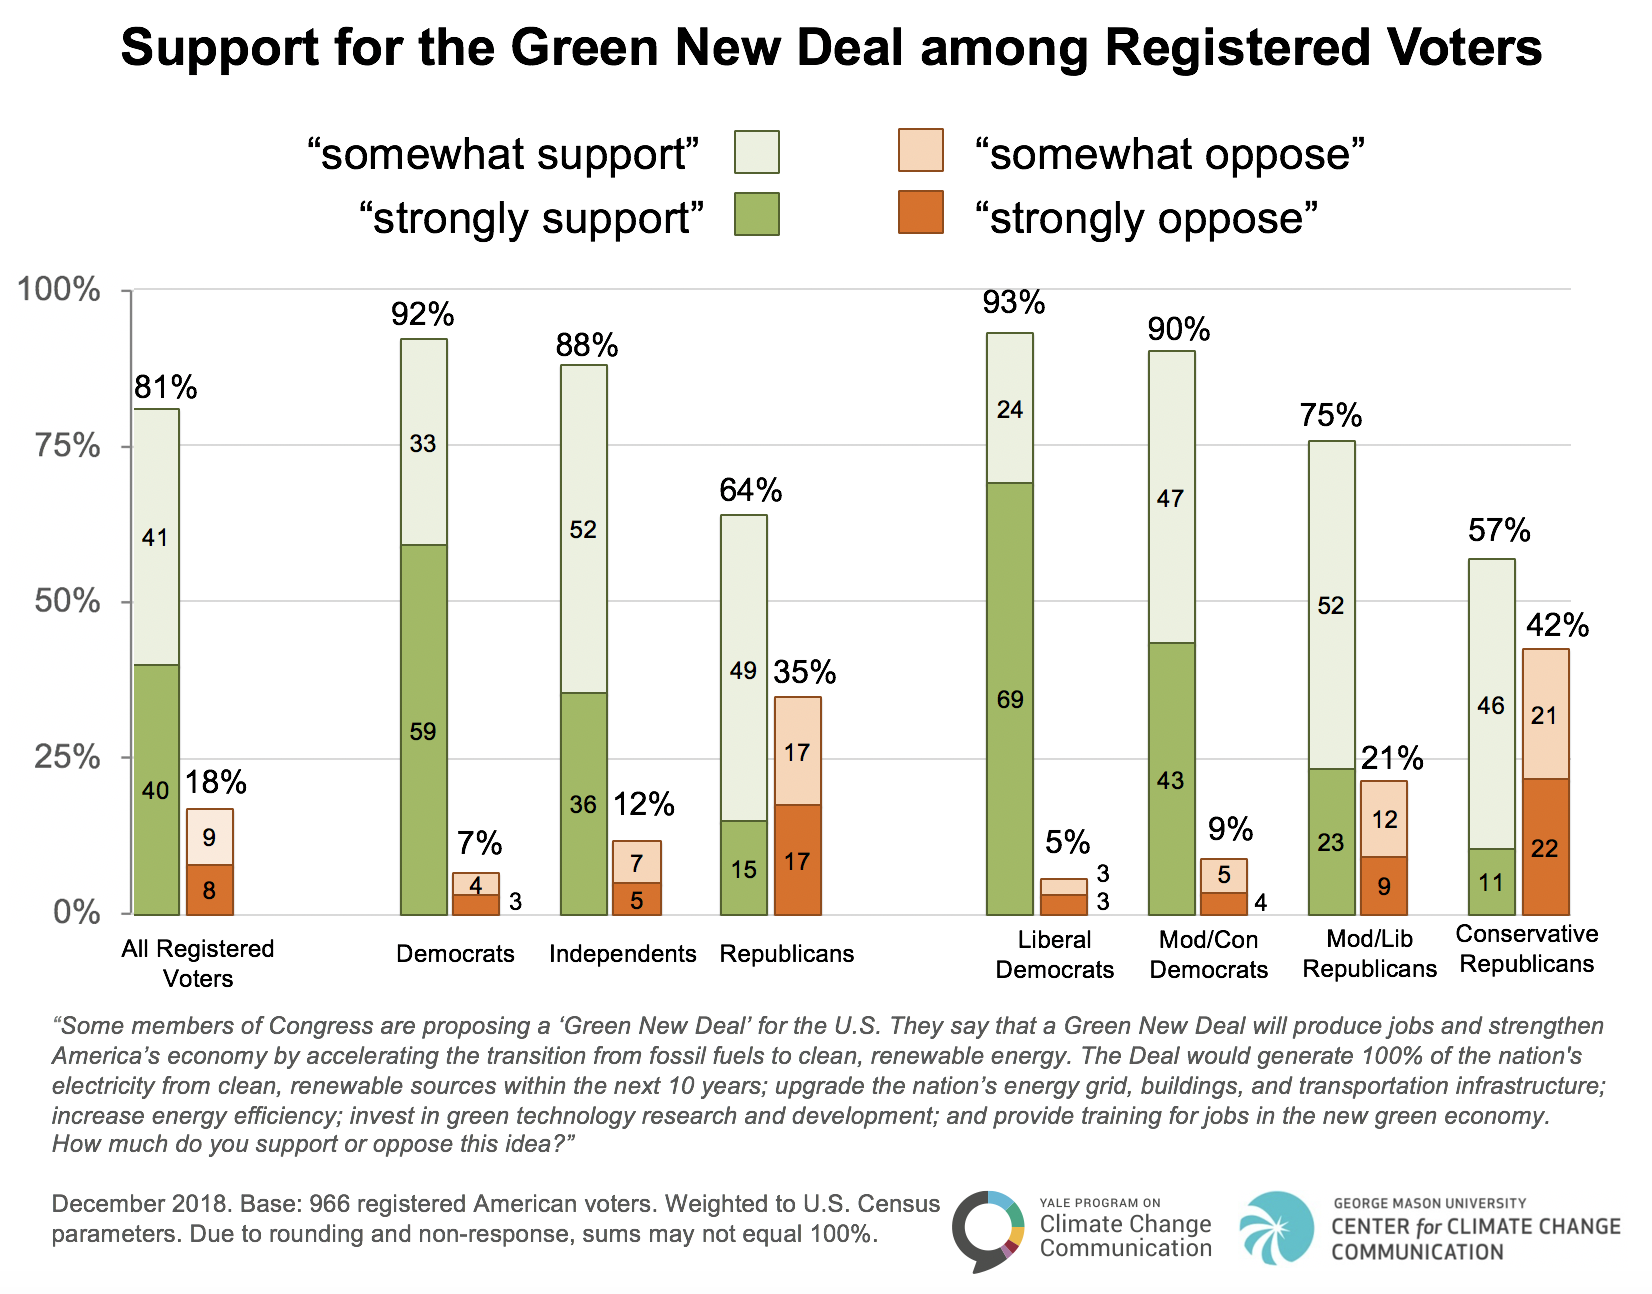
As expected, support is strongest among Democrats (92%). But a large majority of Republicans (64%) – including conservative Republicans (57%) – also support the policy goals in our description of the Green New Deal.
Notably, although our description of the Deal accurately provided details about the proposal, it did not mention that the Green New Deal is championed by Democratic members of Congress such as Alexandria Ocasio-Cortez (D-NY) and John Lewis (D-GA). Other research has shown that people evaluate policies more negatively when they are told it is backed by politicians from an opposing political party. Conversely, people evaluate the same policy more positively when told it is backed by politicians from their own party.
Therefore, these findings may indicate that although most Republicans and conservatives are in favor of the Green New Deal’s policies in principle, they are not yet aware that this plan is proposed by the political Left. For any survey respondents who were previously unaware of the Deal, it is likely that their reactions have not yet been influenced by partisan loyalty.
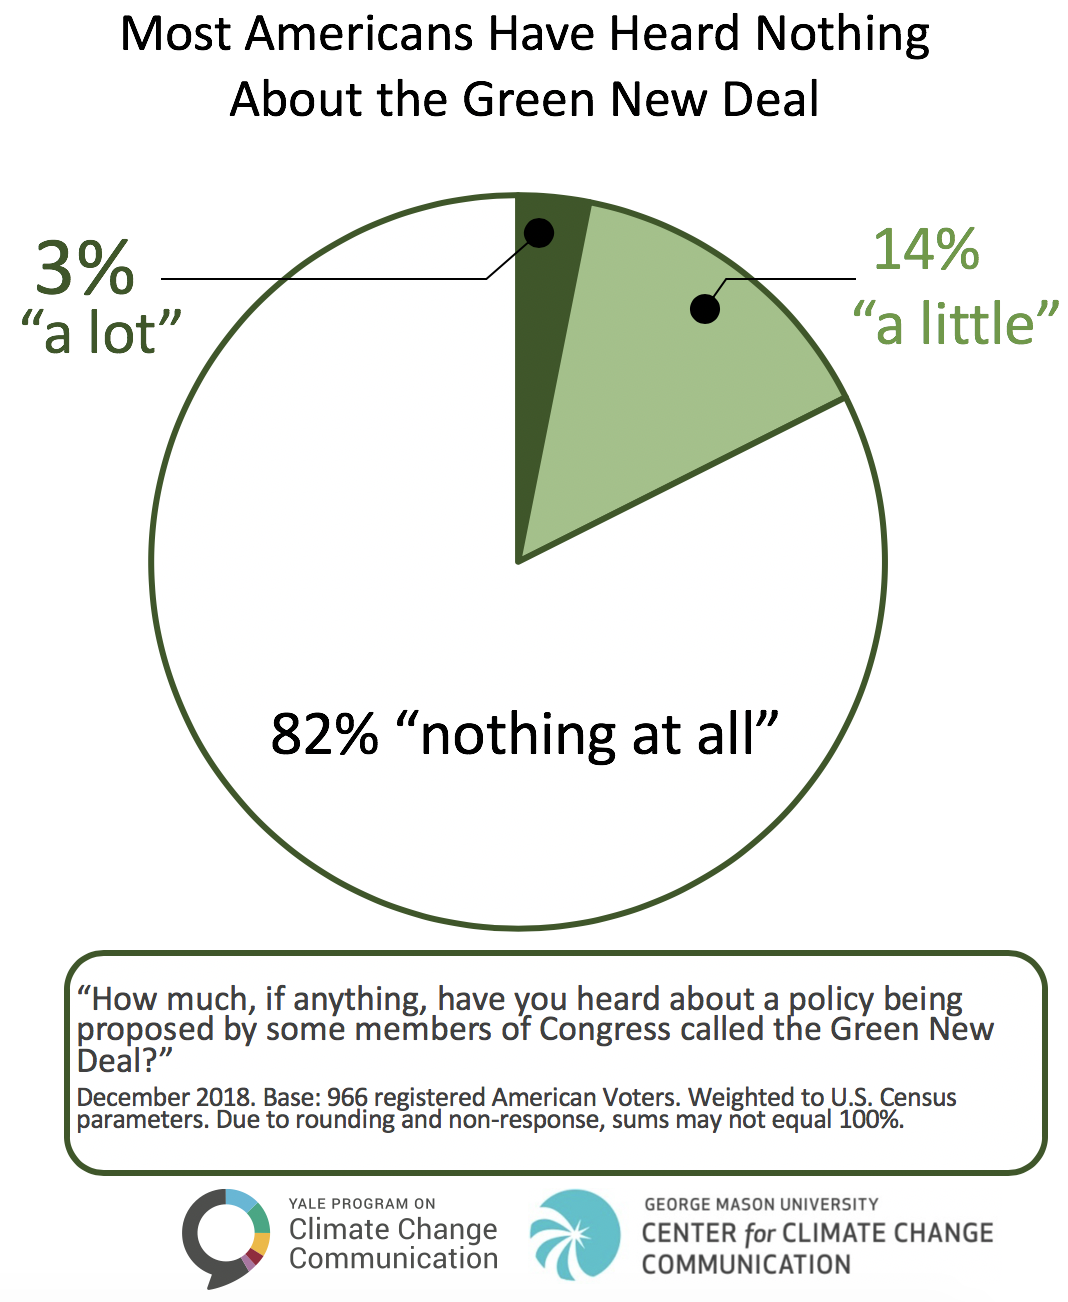
Indeed, before we shared our description of the Deal with survey participants, we first asked them how much, if anything, they had heard about it. Very few people had heard about it. In fact, 82% of registered voters had heard “nothing at all” about the Deal.
One potential implication is that partisan polarization about a Green New Deal could increase in the future. Going forward, the Deal will likely require bipartisan support among political and media elites to maintain existing bipartisan support.
Anticipating and making the public aware of potential arguments that may be used against the Green New Deal may also help maintain public support for it. In contrast, partisan framing in communicating about the Green New Deal – by either the Right or the Left – could activate partisan associations and erode the existing bipartisan support for the concept.
This nationally-representative survey also measured Americans’ opinions about many other aspects of climate change, climate policy, and renewable energy, and assessed how opinions vary by demographics and ideology. Additional findings from this survey will be published in a series of reports beginning in January 2019.
Methods
These data were produced by the bi-annual Climate Change in the American Mind survey — a nationally-representative analysis of public opinion on climate change in the United States conducted by the Yale Program on Climate Change Communication and the George Mason University Center for Climate Change Communication.
Surveys were conducted using the Ipsos KnowledgePanel®, a representative online panel of U.S. adults (18+), from November 28 to December 11, 2018. All questionnaires were self-administered by respondents in a web-based environment. This report includes the registered voters (n=966), from the full sample (n=1,114). Unweighted base sizes for the political subgroups are as follows: Democrats (n=466; liberal Democrats n=295, moderate/conservative Democrats n=168), Republicans (n=356; conservative Republicans n=238, moderate/liberal Republicans n=116), Independents (n=95).
References to Republicans and Democrats throughout include respondents who initially identify as either a Republican or Democrat, as well as those who do not initially identify as Republicans or Democrats but who say they “are closer to” one party or the other (i.e., “leaners”) in a follow-up question. The category “Independents” does not include any of these “leaners.”
Average margin of error for both the full sample and registered voter subset: +/- 3 percentage points at the 95% confidence level. The margin of error for each political subgroup is larger. Bases specified are unweighted, but percentages are weighted to align with U.S. Census parameters. For tabulation purposes, percentage points are rounded to the nearest whole number. As a result, percentages in a given chart may total slightly higher or lower than 100%. Additionally, summed response categories (e.g., “strongly support” + “somewhat support”) are rounded after sums are calculated (e.g., 1.3% + 1.3% = 2.6%, which, after rounding would appear in a chart as 1% + 1% = 3%).