Climate Note · Jul 11, 2023
Does climate change make you sneeze?
By Matthew Ballew, Jennifer Marlon, Samantha Harrington, Seth Rosenthal, Edward Maibach, John Kotcher and Anthony Leiserowitz
Filed under: Audiences and Beliefs & Attitudes

Does it feel like allergy seasons are getting worse? If so, you’re right. Allergy season is starting earlier, lasting longer, and becoming more severe – and climate change is largely responsible for these changes.
Warmer temperatures and shifting seasons affect plants and, in turn, can increase respiratory illnesses among people. Scientists have found that in North America from 1990 to 2018, there was a 21% increase in pollen concentrations and that climate change was the primary driver. As a result, as the world continues to warm, pollen seasons are expected to become more severe, which will impact respiratory health (e.g., allergies, asthma, viral infections) and potentially have cascading effects on the economy. Additional pollen exposure is especially dangerous for children, people with asthma, and people living in areas with high levels of air pollution – including communities of color who are disproportionately affected by air pollution.
In this analysis, we investigate whether Americans think allergy season has become more or less severe in their area in the past few years. We also explore differences in these perceptions among Global Warming’s Six Americas – a spectrum of six groups within the American public that have distinct responses to global warming. At one end of the spectrum are the Alarmed, who are the most likely to think global warming is happening and are the most worried about it. At the other end are the Dismissive, who are the most likely to think global warming is not happening and are the least worried about it. To maximize the sample size of each Six Americas segment, we combine data from three surveys (n = 3,079) conducted in December 2020, March 2021, and September 2021.
Results
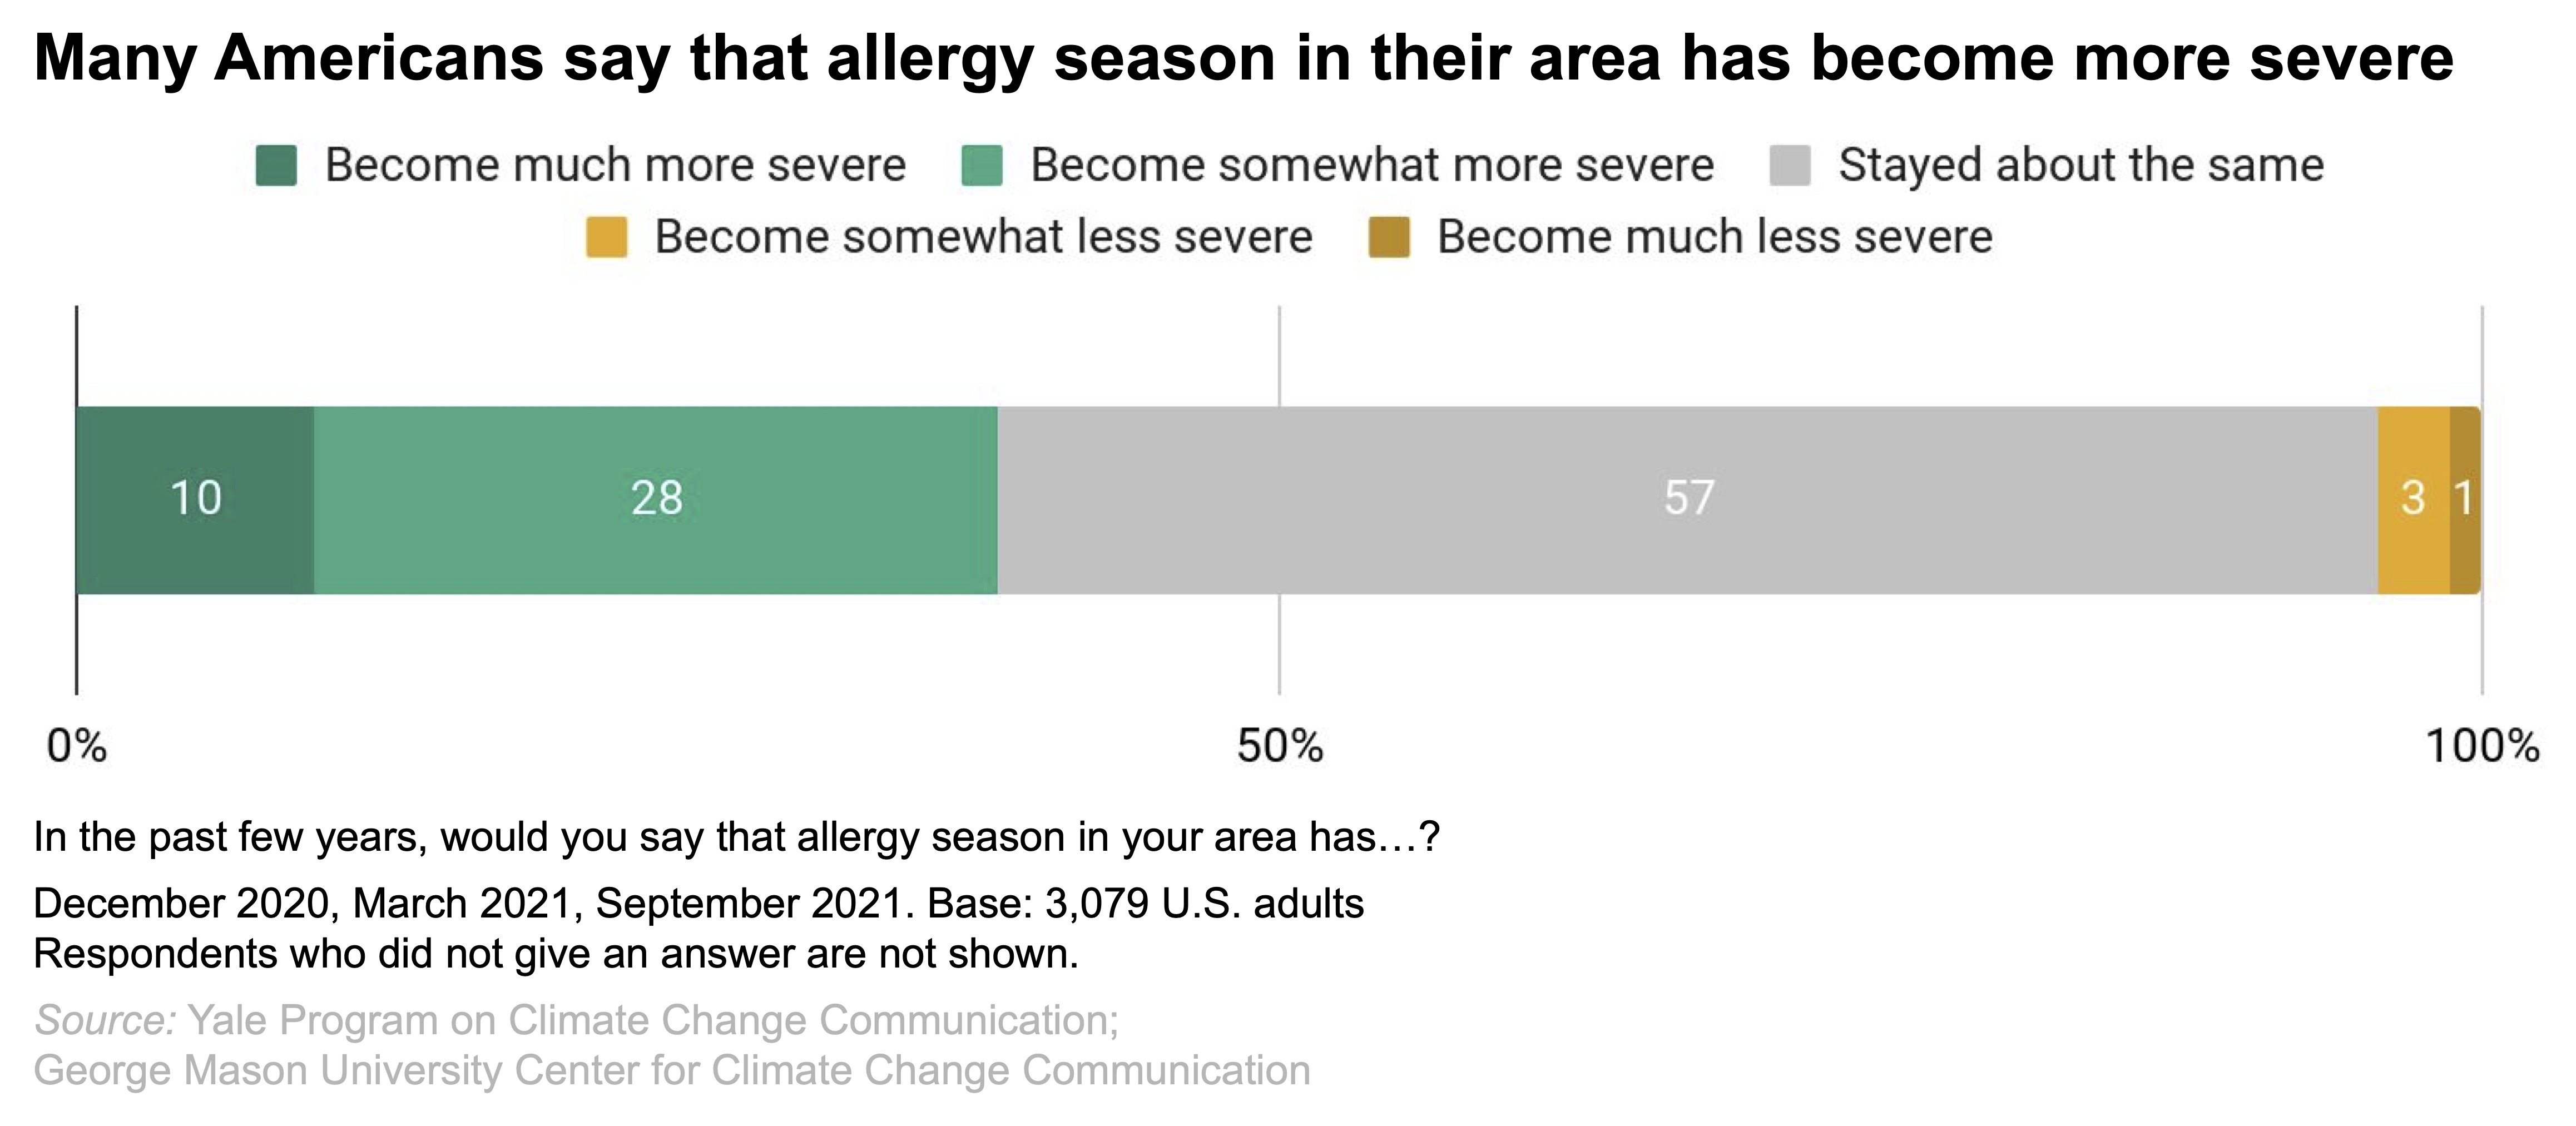
Americans are far more likely to say that allergy season in their area has gotten worse rather than better, although a majority (57%) think that it has stayed about the same. Many Americans (38%) say that allergy season in their area has become either “somewhat more” (28%) or “much more” (10%) severe in the past few years. By contrast, very few Americans (4%) say that allergy season in their area has become either “somewhat less” (3%) or “much less” (1%) severe.
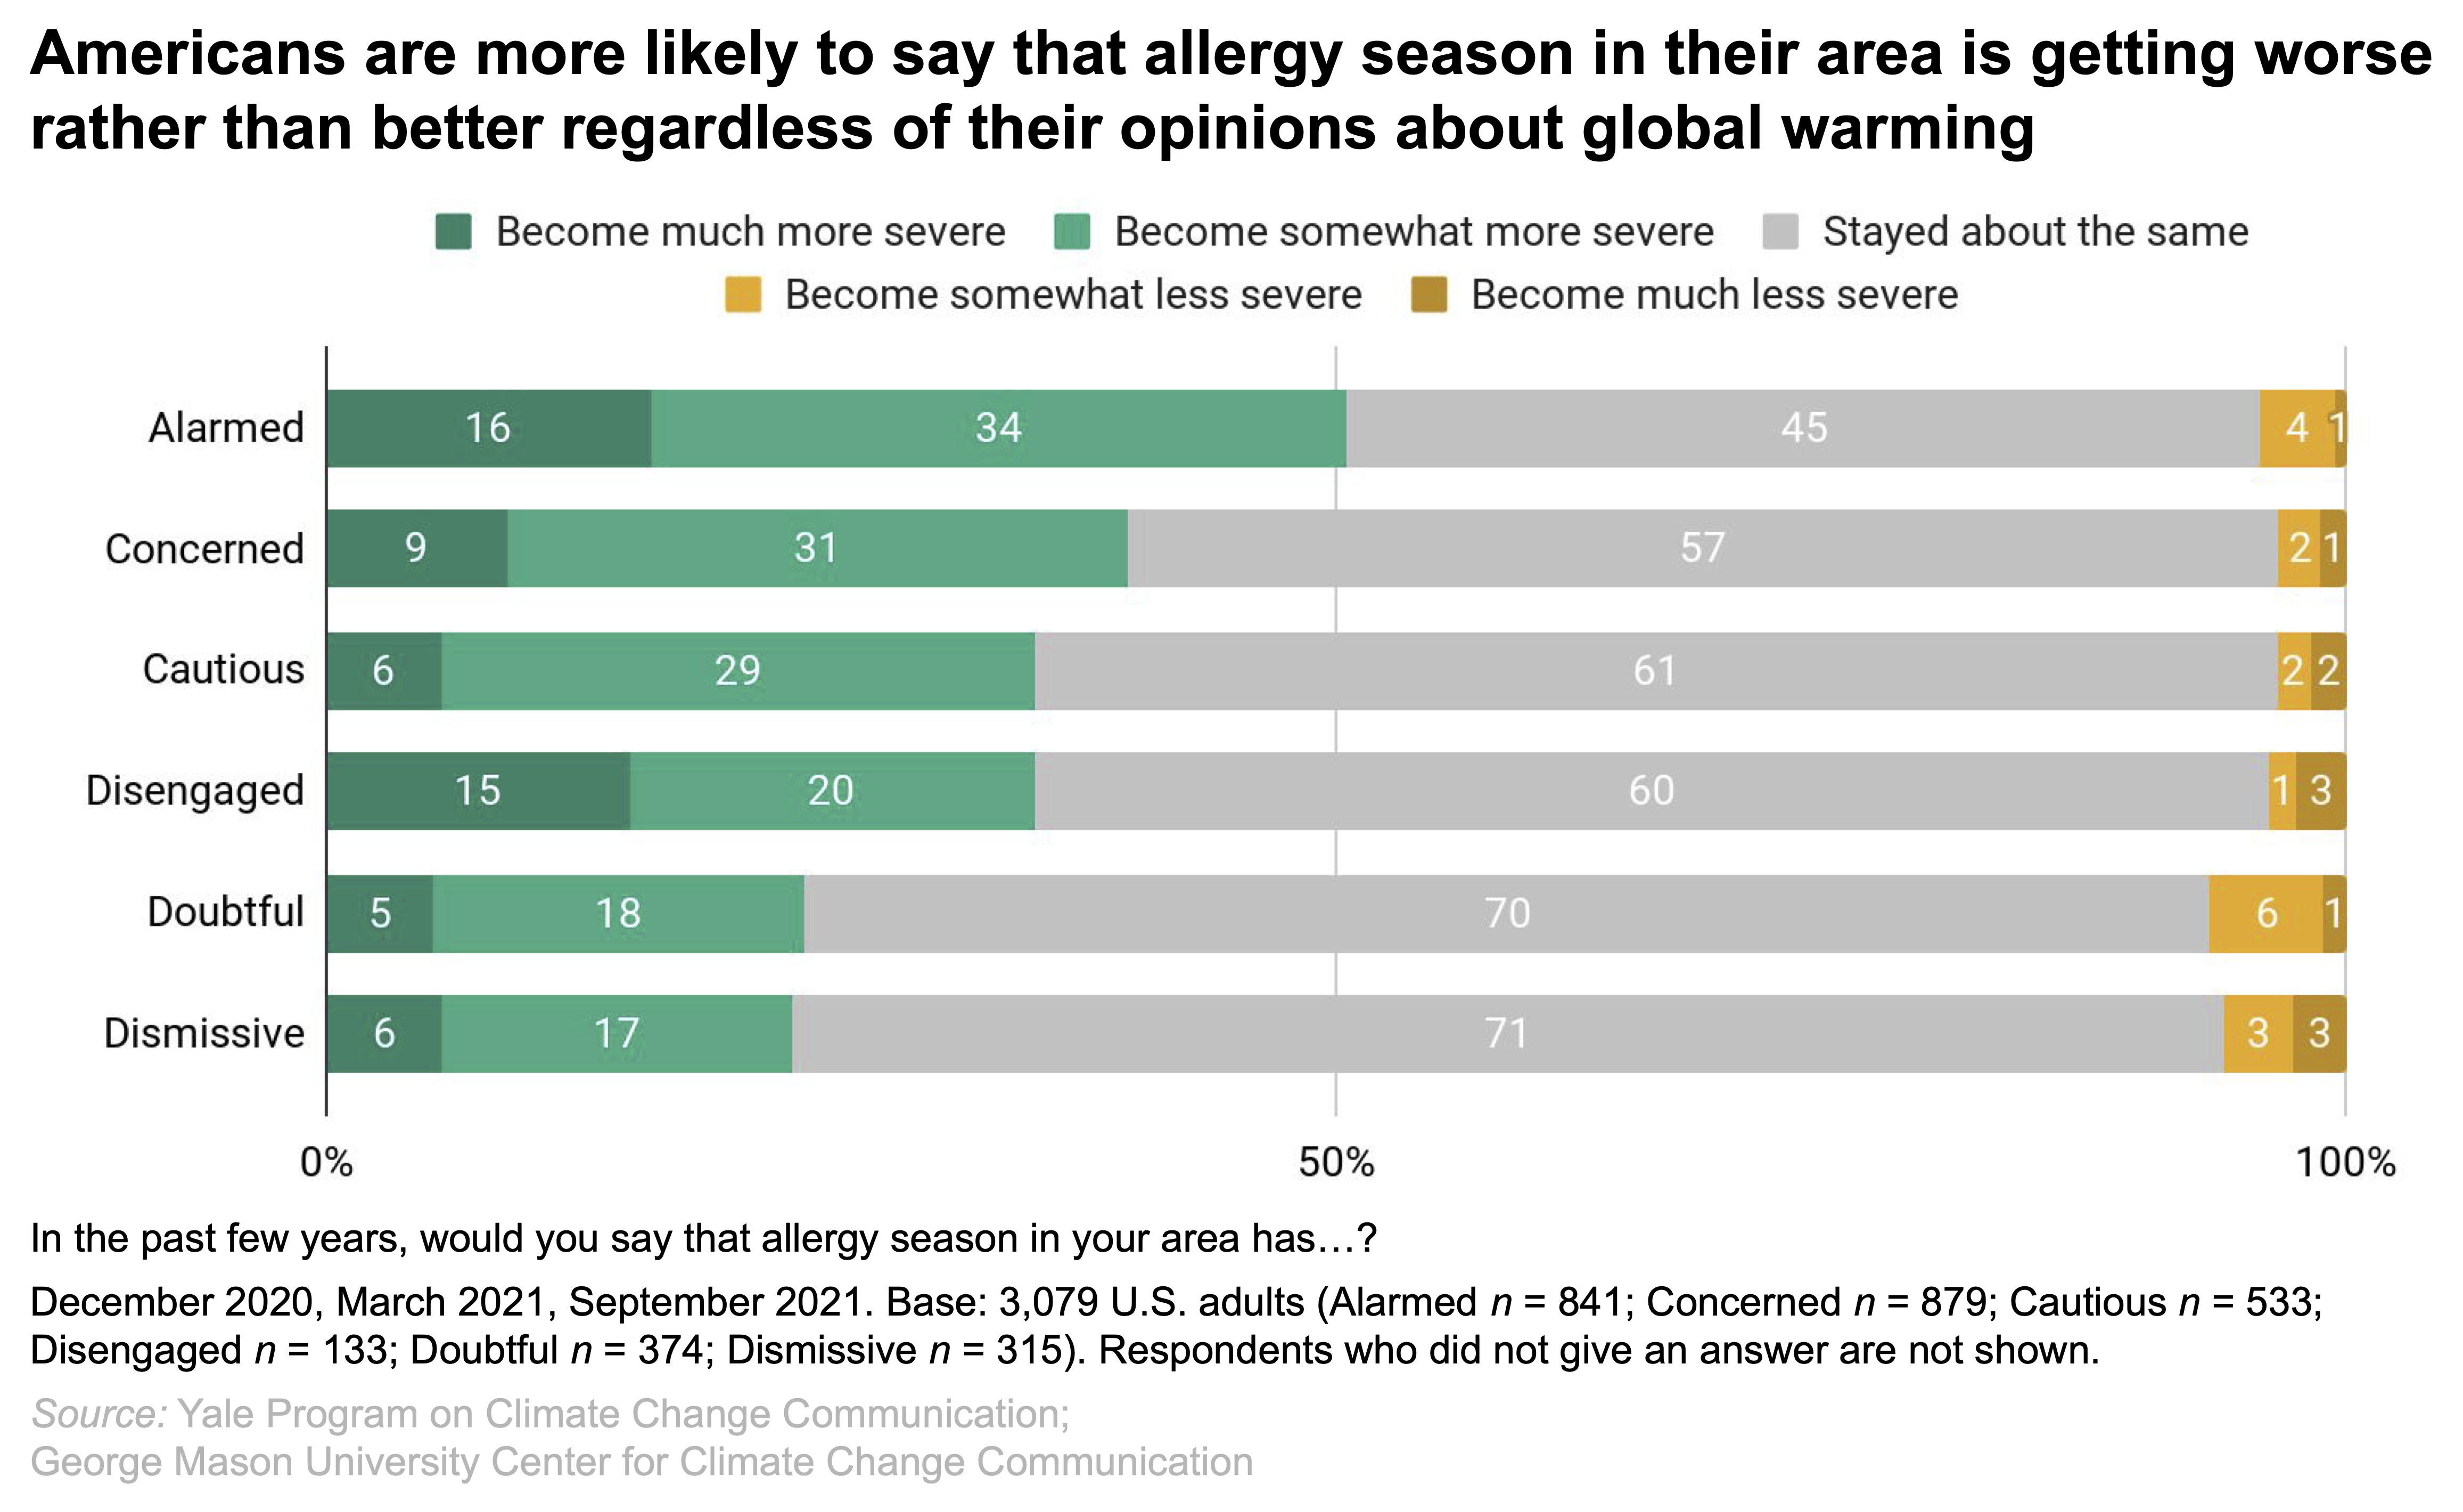
Additionally, Americans’ beliefs about their local allergy season is related to their views about global warming. Even so, people across each of Global Warming’s Six Americas segments are more likely to say that allergy season has become worse rather than better. The Alarmed are the most likely to say allergy season in their area has become more severe (50%) rather than less severe (4%)Percentage points are rounded to the nearest whole number for tabulation purposes and summed categories (e.g., “Become somewhat less severe” + “Become much less severe”) are rounded after sums are calculated (e.g., 3.57% + 0.65% = 4.22%, which, after rounding would appear in this report as 4% + 1% = 4%). Percentages in a given chart may total slightly higher or lower than 100%. over the past few years. The Doubtful and Dismissive also tend to agree that allergy season has become more severe (24% and 23% respectively) rather than less severe (7% and 6%).
Overall, these results suggest that nearly 4 out of 10 Americans understand that allergy season is getting worse. However, many people may not understand that global warming is the primary cause of this trend. It is important for communicators and educators to explain that climate change is already impacting people’s health and exacerbating illnesses like allergies and asthma from increased pollen production. Climate change is also increasing mortality from heat waves (known as the ‘silent killer’) as well as the frequency and severity of wildfires, which can worsen respiratory illness such as asthma through exposure to wildfire smoke.
There are steps people can take to protect themselves from worsening allergy seasons. For instance, allergy sufferers can take steps to avoid triggers and reduce contact with allergens (e.g., by wearing a mask when mowing the lawn), and many medications are available to manage symptoms. Addressing the root cause, however, requires accelerating the transition from burning the fossil fuels warming our planet to cleaner sources of energy. There are many actions individuals and communities can take. Check out our Climate Connections podcast for examples of many such efforts already underway.
Methods
The results of this report are based on three waves of survey data (n = 3,079) of the bi-annual Climate Change in the American Mind survey – a nationally representative survey of U.S. public opinion on climate change conducted by the Yale Program on Climate Change Communication and the George Mason University Center for Climate Change Communication. Data were collected in December 2020 (n = 1,036), March 2021 (n = 1,037), and September 2021 (n = 1,006) using the Ipsos KnowledgePanel®, a representative online panel of U.S. adults ages 18 and older. Respondents self-administered the questionnaires online in a web-based environment. The audience segmentation analysis used the Six Americas Super Short Survey (SASSY) tool.
Data for each survey wave were weighted to align with demographic parameters in the United States. In figures/data tables, bases specified are unweighted, while percentages are weighted to match national population parameters. For tabulation purposes, percentage points are rounded to the nearest whole number. As a result, percentages in a given chart may total slightly higher or lower than 100%. Additionally, summed categories (e.g., “Become somewhat less severe” + “Become much less severe”) are rounded after sums are calculated (e.g., 3.57% + 0.65% = 4.22%, which, after rounding would appear in this report as 4% + 1% = 4%). The average margin of error is +/- 1.8 percentage points at the 95% confidence interval for the full sample of U.S. adults (n = 3,079). The data tables used to develop the charts/figures include the margins of error at the 95% confidence interval for each subgroup.