Climate Note · Jun 27, 2024
Understanding pro-climate voters in the United States
By Jennifer Carman, Matthew Ballew, Marija Verner, Seth Rosenthal, John Kotcher, Edward Maibach and Anthony Leiserowitz
Filed under: Policy & Politics

2024 is a critically important election year for the climate, both in the U.S. and around the world. Many important federal climate policies, including the transition to clean energy, investments in underserved and more vulnerable communities, and participation in international climate treaties, will be determined by voters’ choices in the 2024 elections. National polls find that Americans rank global warming as a lower policy priority than many other issues. However, these findings may underestimate support for action because a large number of Americans think that global warming is a very important voting issue, even if it is not at the very top of their list.
Using data from our latest Climate Change in the American Mind survey, we analyzed data from pro-climate voters, or registered voters in the U.S. who say both that global warming is a “very important” issue to their vote for president and that they prefer to vote for candidates who support action on global warming.
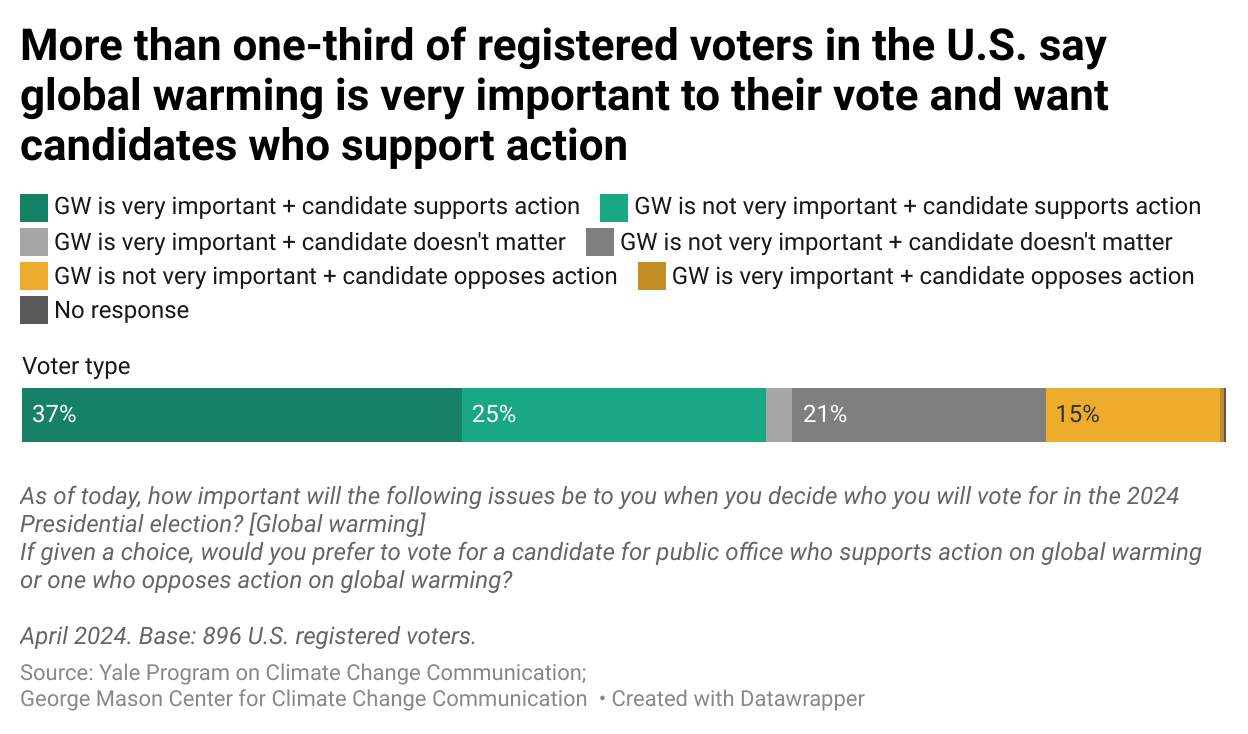
In our survey, respondents first rated the importance of global warming and 27 other issues in terms of influencing their 2024 presidential vote (on a scale of “very important,” “moderately important,” “only a little important,” or “not at all important,” which included a “not sure” option). Later in the survey, they answered a different question about whether they preferred a candidate who supports or opposes action on global warming. We used their responses to these two questions to identify “pro-climate voters” as people who said both that global warming is a very important issue to their vote and that they prefer a candidate who supports action on global warming.
Just over one-third (37%) of registered voters in the U.S. are pro-climate voters. Notably, an additional 25% of registered voters also prefer a candidate who supports climate action even though they do not say that global warming is a very important voting issue to them. Most other respondents indicated that climate change will not factor into their voting choices, but importantly, virtually no registered voters said that global warming was a very important issue and that they prefer a candidate who opposes action.
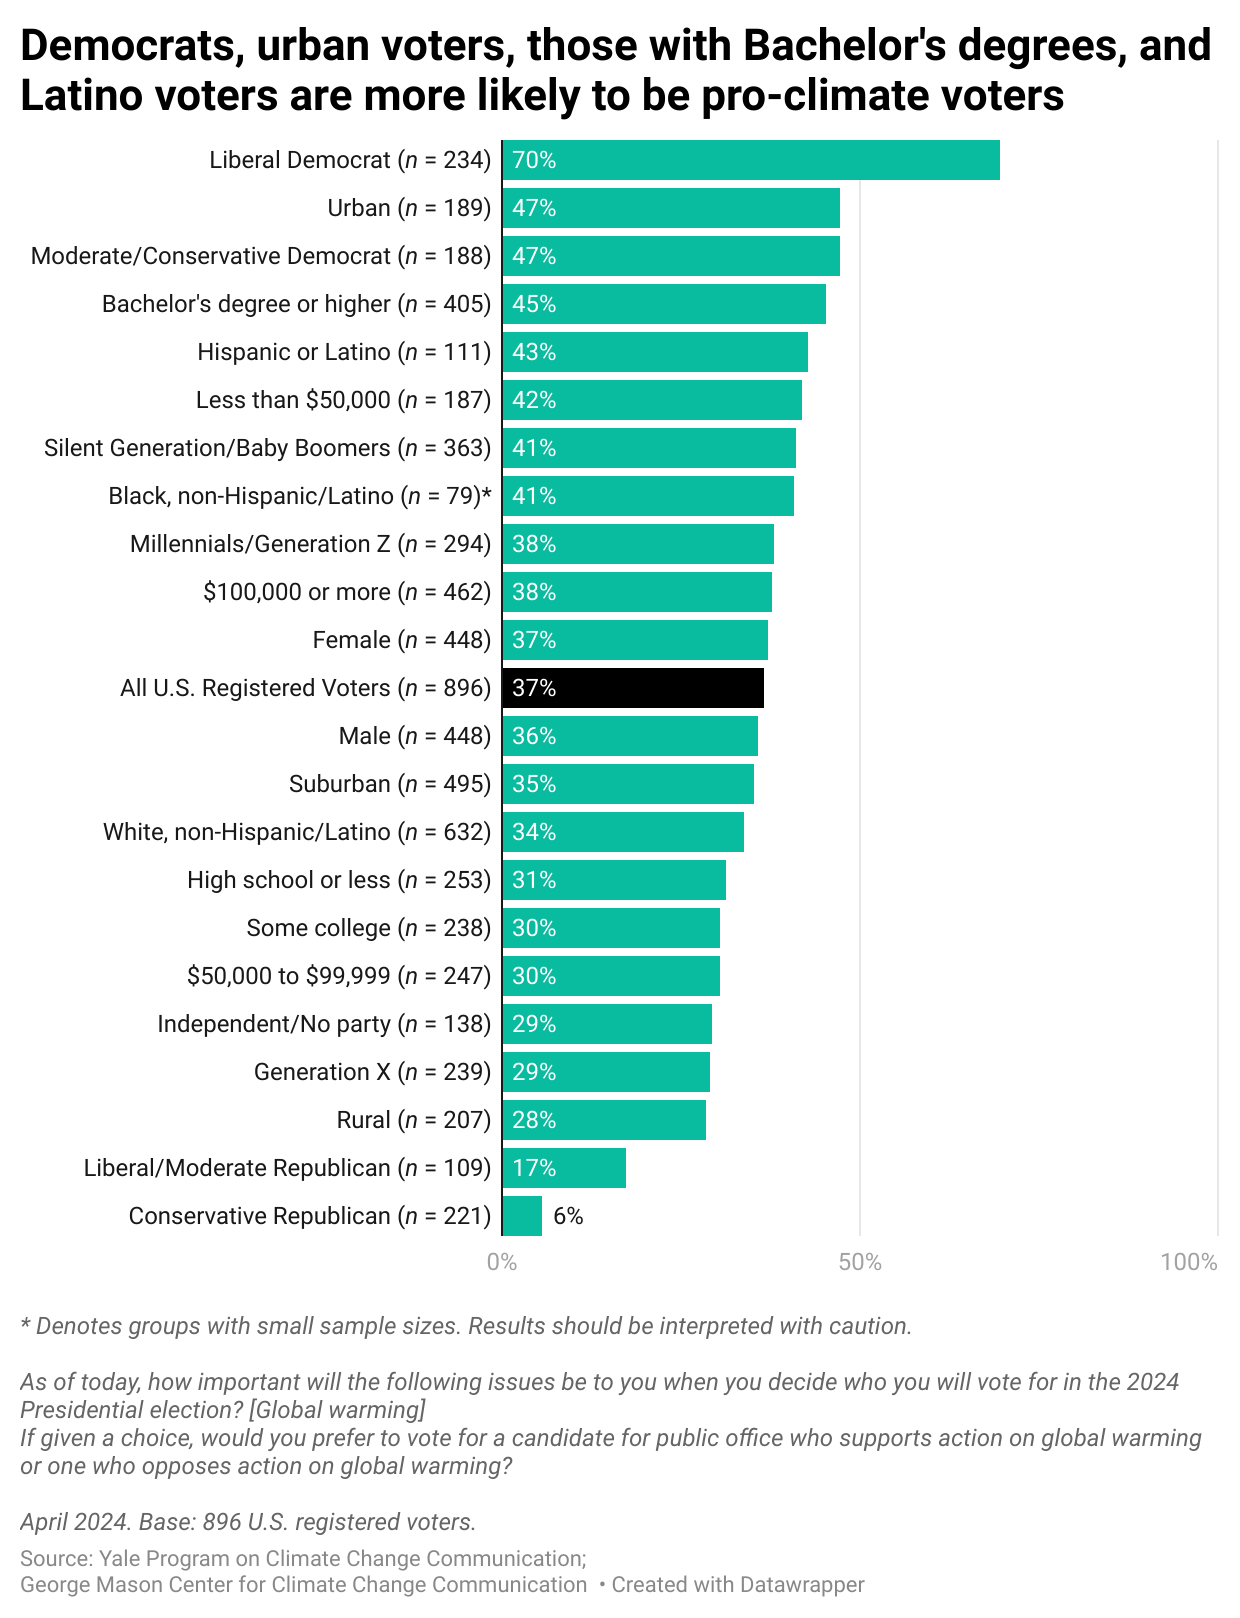
Liberal Democrats are the group most likely to be pro-climate voters (70%), followed by urban residents (47%), Moderate/Conservative Democrats (47%), those with a Bachelor’s degree or higher (45%), and Hispanics/Latinos (43%).
Social engagement among pro-climate voters
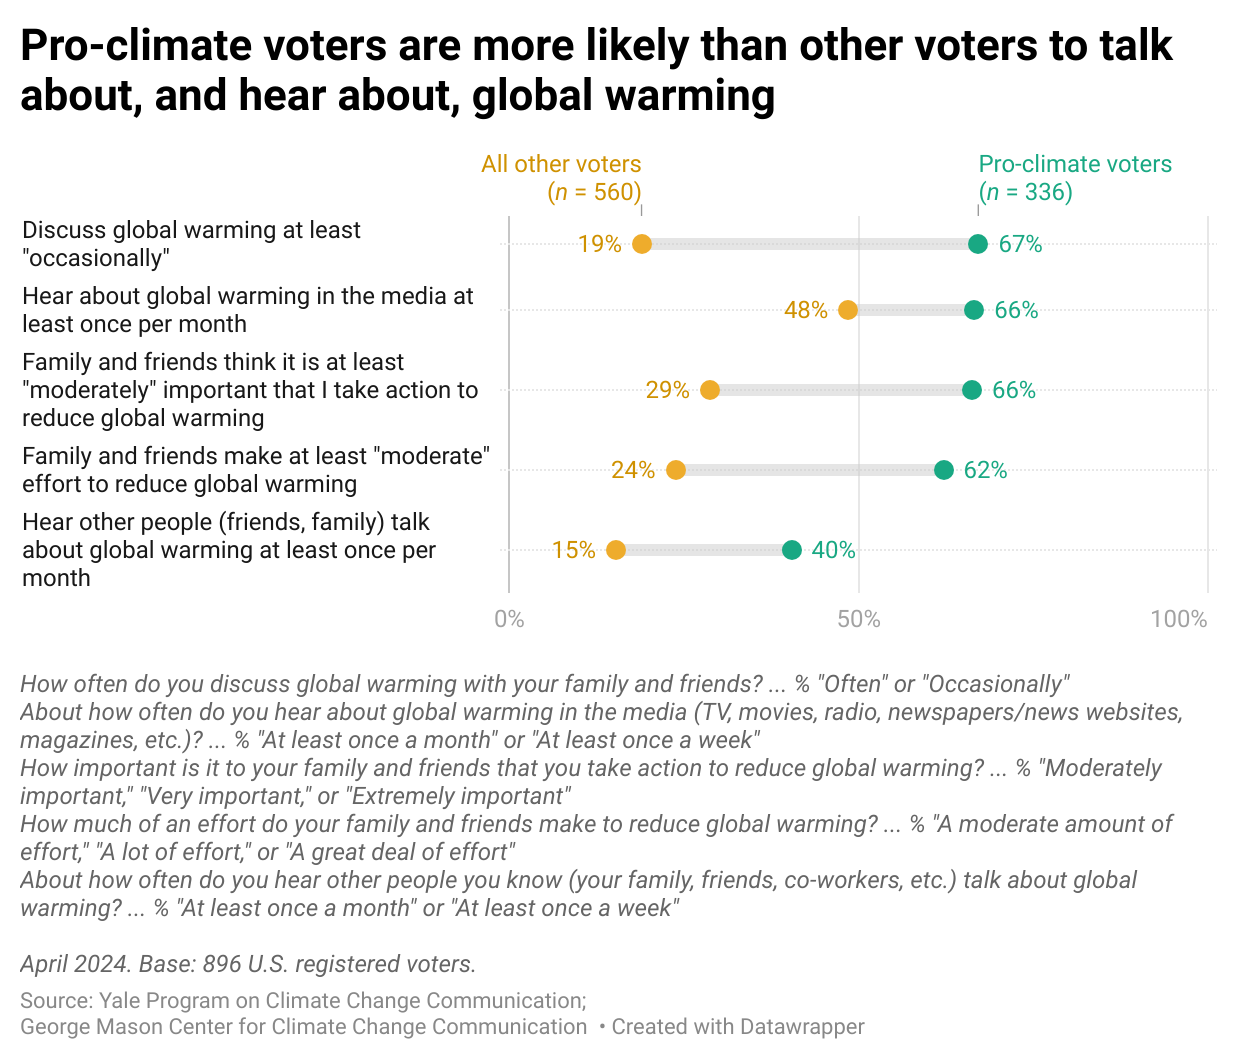
We found that pro-climate voters are more likely than all other voters to discuss global warming at least occasionally (67% vs. 19%), to hear about global warming in the media at least once per month (66% vs. 48%), to say that taking action on global warming is important to their family and friends (66% vs. 29%), to say that their family and friends make an effort to reduce global warming (62% vs. 24%), and to say that they hear other people about global warming at least once a month (40% vs. 15%).
Political engagement among pro-climate voters
In 2022, the U.S. Congress passed, and President Biden signed, the Inflation Reduction Act, or IRA. This law is the largest Congressional investment in climate action in U.S. history, and includes billions of dollars in investments in renewable energy, tax incentives for electric vehicle and home energy efficiency upgrades, as well as investments in rural economies and communities disproportionately affected by climate change.
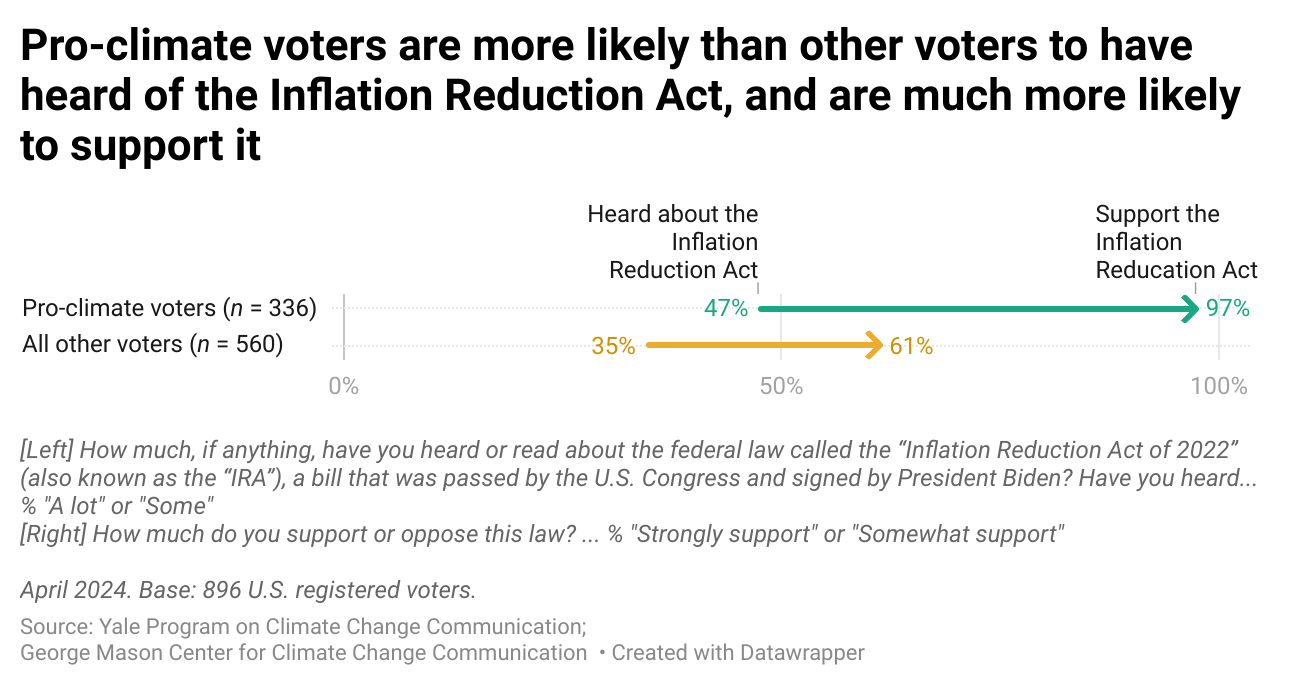
Our research since 2022 has found that relatively few voters have heard much about the IRA, although this number has been increasing over time. Here, we find that this trend persists even among pro-climate voters. Only about half of pro-climate voters say they have heard “some” or “a lot” about the IRA (47%), although the proportion is higher than all other voters (35%).
After reading a short description of the IRA (refer to Methods section below), a majority of registered voters supported it. However, pro-climate voters supported the IRA much more strongly (97%) than other voters (61%).
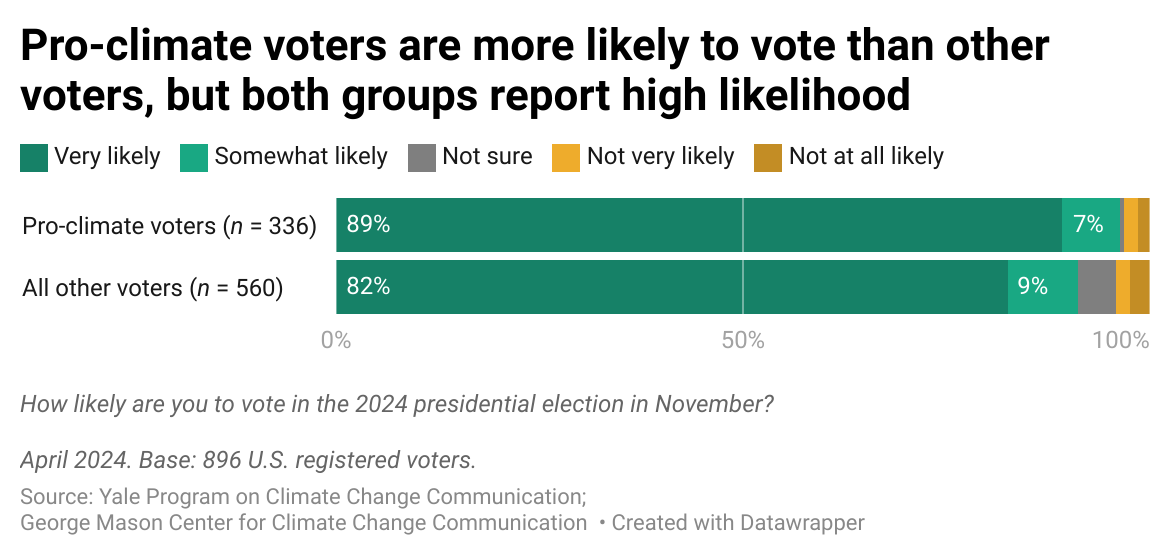
In addition, we asked registered voters how likely they are to vote in the November 2024 presidential election. Pro-climate voters are more likely (89% “very likely” and 7% “somewhat likely”) compared with other voters (82% “very likely” and 9% “somewhat likely”).
Key Takeaways
A significant proportion of American registered voters (37%) are pro-climate voters. According to the most recent data available from the Census Bureau, there are more than 161 million registered voters in the United States. This suggests that there are nearly 60 million pro-climate voters in the U.S. Moreover, the great majority of these voters say they plan to vote in the 2024 presidential election. In a close election – as 2024 is expected to be – these voters could be decisive.
Only about half of pro-climate voters say they are familiar with the Inflation Reduction Act, but after reading a short description of it, nearly all pro-climate voters say they support it. Moreover, the Inflation Reduction Act has majority support even from voters who do not prioritize climate action.
Our analysis finds that pro-climate voters are already more likely to talk about global warming compared with other voters, but only 40% say they hear other people they know talk about global warming. Additionally, our analysis finds that 25% of registered voters overall do not say that global warming is a very important issue to their vote, but they nonetheless prefer a candidate who supports action on global warming.
Finally, although a large majority of pro-climate voters say they are likely to vote, not all of them are. Normative messages, such as letting people know that many people in their community are voting, including their own friends and family members, can encourage people to vote when they might not otherwise. Additionally, organizations like the Environmental Voter Project identify and engage low-likelihood voters who are concerned about environmental issues.
Methods
The results of this report are based on data from the April 2024 wave (n = 1,031, including 896 registered voters) of the twice-yearly Climate Change in the American Mind survey – a nationally representative survey of U.S. public opinion on climate change conducted by the Yale Program on Climate Change Communication and the George Mason University Center for Climate Change Communication. Data were collected from April 25 – May 4, 2024, using the Ipsos KnowledgePanel®, a representative online panel of U.S. adults ages 18 and older. Questionnaires were self-administered online in a web-based environment.
Data were weighted to align with demographic parameters in the United States. Following Pew Research Center’s approach, generational cohort and year of birth were calculated based on the age of respondents at the time of data collection (Gen Z: 1997-2012; Millennial: 1981-1996; Gen X: 1965-1980; Baby Boomer: 1946-1964; Silent Generation: 1928-1945). Because generational cohort classification was based on respondents’ age at the time they took the survey (rather than birth year, which was not known), some respondents on the cusp of two generations may be miscategorized.
Among the subset of registered voters, references to Republicans and Democrats throughout include respondents who initially identify as either a Republican or Democrat, as well as those who do not initially identify as a Republican or Democrat but who say they “are closer to” one of those parties (i.e., “leaners”) in a follow-up question. The category “Independents” does not include any of these “leaners.” Independents and respondents who do not identify with a party or are not interested in politics are not included in this report.
Pro-climate voters were classified based on the responses to two questions, “As of today, how important will the following issues be to you when you decide who to vote for in the November 2024 Presidential election? [Global warming]?”, and “If given a choice, would you prefer to vote for a candidate for public office who [opposes/supports] action on global warming or one who [supports/opposes] action on global warming?” Respondents who said “Very important” for the first question and “A candidate who supports action on global warming” for the second question were classified as pro-climate voters, while all other respondents were classified as all other voters. Demographics for the two voter groups are presented in the data tables.
In figures/data tables, bases specified are unweighted, while percentages are weighted to match national population parameters. For tabulation purposes, percentage points are rounded to the nearest whole number.
Group differences were tested for statistical significance using the weighted proportions and unweighted sample sizes of each group. The average margin of error is +/- 3 percentage points at the 95% confidence interval for the full sample of U.S. adults (n = 1,031) and +/- 3.3 percentage points for the subset of registered voters who participated in the survey (n = 896). Average margins of error at the 95% confidence interval for the subgroups are:
- Climate Voter Status:
- Pro-climate voters +/- 5.3 percentage points (n = 336)
- All other voters +/- 4.1 percentage points (n = 560)
- Demographics:
- Black (non-Hispanic/Latino) +/- 11.0 percentage points (n = 79)
- Hispanic/Latino +/- 9.3 percentage points (n = 111)
- White (non-Hispanic/Latino) +/- 3.9 percentage points (n = 632)
- Earn less than $50,000 annually +/- 7.2 percentage points (n = 187)
- Earn $50,000-$99,999 annually +/- 6.2 percentage points (n = 247)
- Earn $100,000 or more annually +/- 4.6 percentage points (n = 462)
- Women +/- 4.6 percentage points (n = 448)
- Men +/- 4.6 percentage points (n = 448)
- Gen Z/Millennial +/- 5.7 percentage points (n = 294)
- Gen X +/- 6.4 percentage points (n = 239)
- Baby Boomer/Silent +/- 5.1 percentage points (n = 363)
- High school or less education +/- 6.1 percentage points (n = 253)
- Some college +/- 6.6 percentage points (n = 238)
- Bachelor’s degree or higher +/- 4.9 percentage points (n = 405)
- Liberal Democrat +/- 6.4 percentage points (n = 234)
- Moderate/conservative Democrat +/- 7.1 percentage points (n = 188)
- Independent/No party +/- 8.3 percentage points (n = 138)
- Liberal/moderate Republican +/- 9.4 percentage points (n = 109)
- Conservative Republican +/- 6.6 percentage points (n = 221)
- Urban +/- 7.1 percentage points (n = 189)
- Suburban +/- 4.4 percentage points (n = 495)
- Rural +/- 6.8 percentage points (n = 207)
The question about support for the Inflation Reduction Act was administered after the question about awareness of it. After being asked about their awareness of the IRA, survey participants read the following description of the IRA: “The Inflation Reduction Act of 2022 (IRA) aims to curb inflation by reducing the federal deficit, lowering prescription drug prices and the cost of health insurance, modernizing the Internal Revenue Service, and investing in U.S. clean energy production. The law authorizes $391 billion for developing clean energy and addressing global warming, including tax incentives and rebates to help consumers and businesses buy energy-efficient appliances, solar panels, electric vehicles, etc. The IRA also includes support for clean energy jobs and investments in communities that are most harmed by air and water pollution. It is the largest investment the U.S. government has ever made to reduce global warming, and is projected to help the U.S. reduce its carbon pollution 40% by 2030. The law will be paid for by closing tax loopholes.”