Climate Note · Jun 5, 2025
Variations in climate opinions across the United Kingdom
By Andrew Gillreath-Brown, Emily Goddard, Martial Jefferson, Emily Richards, Jennifer Carman, Seth Rosenthal, Anthony Leiserowitz and Jennifer Marlon
Filed under: Beliefs & Attitudes, Climate Impacts and Policy & Politics
We are excited to launch the Yale Climate Opinion Maps for the United Kingdom—a new interactive mapping tool that depicts public climate change beliefs, risk perceptions, policy support, experiences, and attribution beliefs across the UK. Built using multilevel regression with post-stratification (MRP) applied to a large national survey dataset (n = 10,078), the maps provide detailed estimates for every country, region, and local authority in the UK.
Climate Change Beliefs and Personal Experiences
A very large majority of adults in the UK think climate change is happening (85%) and human-caused (74%), but many also perceive climate change as a relatively distant threat. Nationally, 84% think climate change will harm future generations, but only 55% think it will harm them personally, with urban residents generally perceiving greater risk than rural residents.
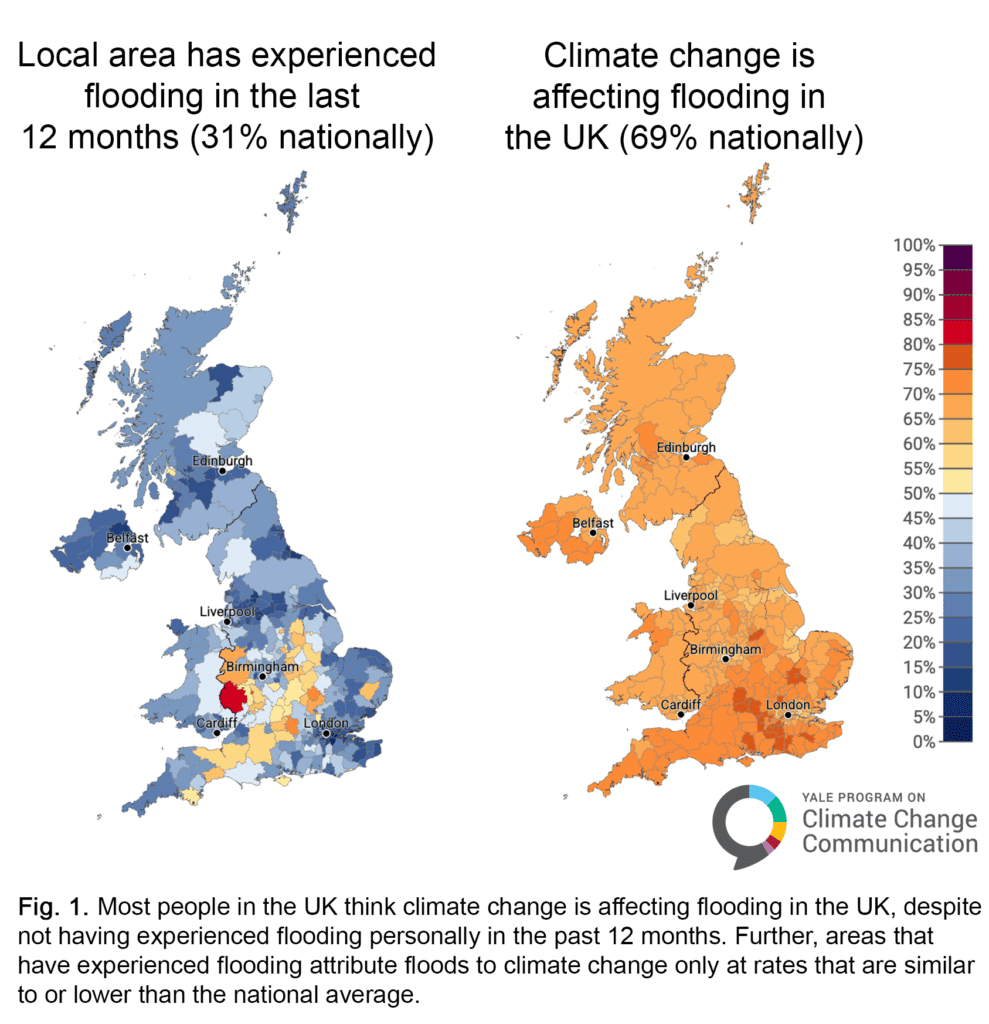
The maps also reveal considerable spatial variability in the types of extreme events that people have experienced in the UK. Large majorities report local flooding in the past year, for instance, in Herefordshire (81%), Worcester (80%), South Oxfordshire (70%), and Bedford (71%), compared to 31% nationally. These four areas all experienced large floods in 2024, including the Worcester floods and flash floods in Herefordshire. While only 8% of British adults nationally report experiencing rising sea levels, that number is over 50% in the Isle of Wight and coastal Gosport. Coastal areas, such as Thanet, Arun, Eastbourne, East Devon, and Isle of Wight, which have experienced increasingly contaminated beaches, also have greater percentages who reported experiencing water pollution—approximately two-thirds, compared to 28% nationally.
Notably, areas where more people report having experienced recent flooding do not tend to attribute flooding to climate change at higher rates than the national average. For example, in Herefordshire and Worcester, where 81% and 80% of adults say they have personally experienced flooding in the last year (+50 and +49 from the national average), 67% and 68% say that climate change is affecting flooding in the UK (-2 and -1 from the national average). By contrast, in the City of Edinburgh in Scotland, 18% of adults say they have personally experienced flooding (-13 from the national average) but 72% say that climate change is affecting flooding in the UK (+3 from the national average).
Although most Britons report that they have not personally experienced recent extreme weather events such as extreme heat (15%), flooding (31%), or droughts (4%), majorities think that climate change is affecting many of these events. For instance, 69% believe that climate change is affecting flooding in the UK, and 50% think it is affecting extreme heat.
Similarly, although only 8% of British adults report experiencing sea level rise, 54% nationally believe that it is being affected by climate change. While Gosport and Isle of Wight are the only areas where over 50% of adults report experiencing sea level rise, belief that climate change is affecting sea level rise is only slightly higher than the national average (56% and 57%, respectively), and is much higher in landlocked Cambridge (67%).
The mismatch between personal experience and climate attribution revealed by the maps is consistent with prior research indicating that direct exposure to extreme weather does not automatically translate into stronger belief that climate change affects these events. Rather, when appropriate, communicators need to help people “connect the dots” between climate change and extreme events, drawing on the findings of attribution science.
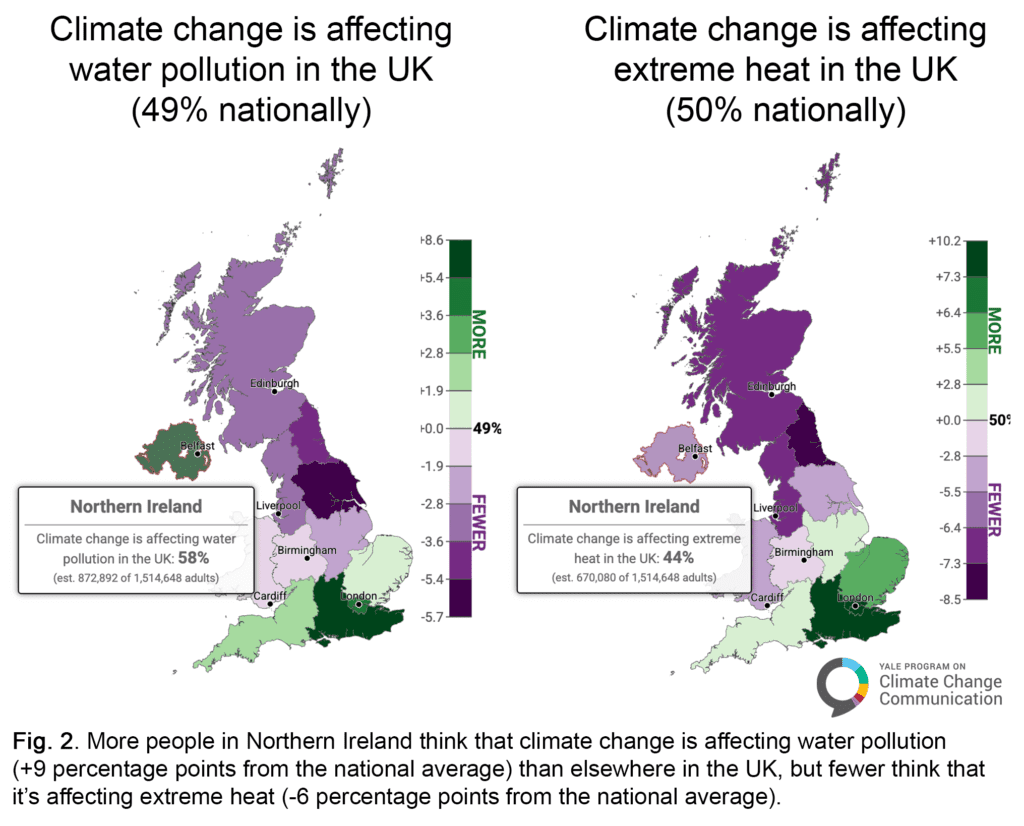
Regional differences in climate change perceptions become more apparent when the maps are set to show differences from national averages (Fig. 2). For example, southern regions of the UK are more likely than northern regions to think that climate change is affecting both water pollution and extreme heat (Fig. 2). In Northern Ireland, however, the public is more likely than the national average to say that climate change is affecting water pollution, but less likely to say it is affecting extreme heat.
Climate Change Policy Support
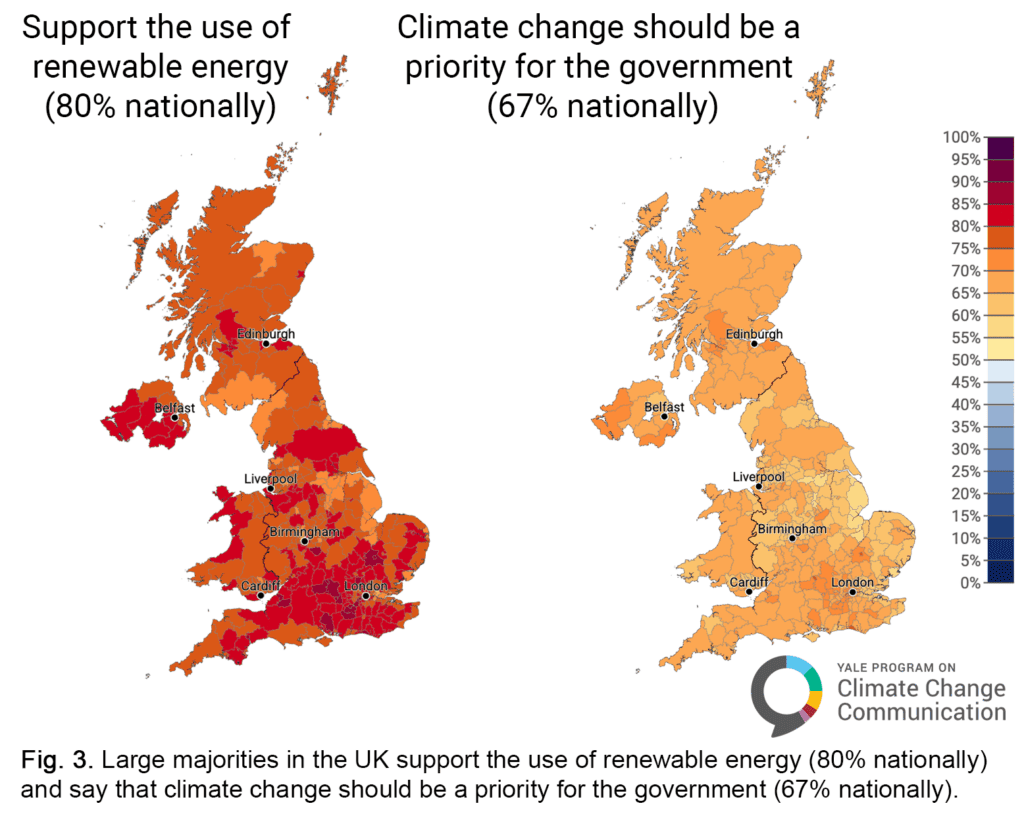
The use of renewable energy for electricity, fuel, and heating is very popular across the UK (80%). Support is highest in southern England – with up to 90% support in some local authorities and at least 69% support across all areas (Fig. 3). Meanwhile, a large majority of the UK public says climate change should be a high priority for the government (67%).
Compared with Americans, UK residents are less polarized in their climate views and more strongly support climate policies. In the US, a slim majority (53%) think that global warming should be a priority for the President and Congress, ranging from 28% in some counties in Montana, Wyoming, Nebraska, and North Dakota to 76% in San Francisco, California — a 48 percentage point difference. In the UK, more than two-thirds (67%) nationally think that climate change should be a priority for the government in the UK, ranging from 58% in East Lindsey to 76% in Oxford, less than half the opinion gap in the US (Fig. 4).
Across the UK, the majority of people understand that climate change is both a global and local threat and support climate action.
Explore the maps by clicking on a specific local authority, region, or country, and compare the results across questions and geographic areas. Below the map are bar charts displaying results for every question at whichever geographic scale is currently selected. See the Methodology tab for more information about uncertainty estimates and the Survey Question Wording tab to see the full question text and how responses were combined for the maps.
Methods
This tool provides estimates of climate change beliefs, risk perceptions, policy support, experience, and attribution perception among people aged 16 and older in the United Kingdom for all countries, regions, and lower-tier local authorities – a new source of high-resolution data on public opinion that can inform decision-making, policy, and education initiatives in the UK. The estimates are derived from a statistical model using multilevel regression with post-stratification (MRP) on a large national survey dataset, along with demographic and geographic population characteristics.
The underlying survey was administered by Ipsos from 7 November to 13 November 2024 and included 10,660 British adults (16+). Respondents came from 12 regions and from 360 of 361 local authorities. Sample weights for all respondents were calculated by Ipsos to be nationally representative and to reflect the large diversity of the British population across sex, age, and socio-economic dimensions. 582 responses were removed due to missing data, resulting in a total sample size of n=10,078. Model development follows the methods described in Howe et al. (2015) to estimate local-scale US public opinion.
Multilevel modeling with poststratification (MRP) was used to estimate the spatial distribution of climate opinions at country, region, and lower-tier local authority levels (Howe et al. 2015; Mildenberger et al. 2016, 2017). Dependent variables were first recoded into binary format, with positive response values grouped and coded as “1” (e.g., “Somewhat favor” and “Strongly favor”) and non-positive values coded as “0” (“Somewhat oppose”, “Strongly oppose”, “Don’t know”, Refused; see “Survey Question Wording” on the interactive map tool tab for a full list of questions and how each was recoded to binary). MRP modeling then proceeded in two phases. First, the multi-level model was constructed by predicting individual survey responses as a function of both individual-level demographics (sex, age, and socio-economic classification, as well as a three-way interaction term among these variables) and one geography-level covariate (voting patterns on leaving the European Union). Second, “post-stratification”, or spatial weighting, was performed using the fitted model, where population-weighted opinion estimates for each demographic-geographic subtype were aggregated based on the subtype population distribution within each geographic subunit.
Voting data for leaving the European Union for each country, region, and lower-tier local authority for England, Wales, and Scotland were obtained from the UK Electoral Commission. These data were then crosswalked from the 2016 local authorities to the 2023 shapefiles used in this study. However, lower-tier local authority data were not available in this report for Northern Ireland. Therefore, we used the constituency-level data for Northern Ireland published by the Electoral Office for Northern Ireland (House of Commons Library), rasterized it in ArcGIS Pro, and then took an average for each 2023 lower-tier local authority to get an approximation of the voting patterns by local authority. The model configuration was selected after testing model fit using a variety of demographic and aggregate variables, including sex, age, socio-economic classification, voting patterns, and percentage of people over 65 years of age in each geography, as well as interaction terms.
The model was validated first by comparing modeled estimates with weighted survey averages at the national level, country level, and for the five most populous regions. The mean absolute error between modeled estimates and weighted survey averages across all variables was 0.92 percentage points at the national level, 1.39 percentage points at the country level, and 1.28 percentage points at the region level. The model was then subsequently validated by comparing two YPCCC results with externally and independently modeled data from More In Common, E3G, and Persuasion UK. Climate change worry was compared with a similar question on climate change worry from More In Common and E3G, and support for renewable energy was compared with a question about support for net zero from Persuasion UK. While the results differed slightly, likely because the questions and response options were not identical, trends across regions and constituencies were similar with both the YPCCC model and the external data.
Uncertainty ranges are based on 95% confidence intervals using bootstrap simulations. These confidence intervals indicate that the model is accurate to approximately ±6 percentage points at the country level, ±6 percentage points at the region level, and ±7 percentage points at the local authority district level. Such error ranges include the error inherent in many of our national surveys, which is typically ±3 percentage points.
The modeling approach used to develop the maps is adapted from Howe, P., Mildenberger, M., Marlon, J.R., and Leiserowitz, A., “Geographic variation in opinions on climate change at state and local scales in the USA,” Nature Climate Change. DOI: 10.1038/nclimate2583.


