Climate Note · Feb 23, 2022
Perceived harm from global warming is becoming more widespread
By Jennifer Marlon, Liz Neyens, Martial Jefferson, Seth Rosenthal, Peter Howe, Matto Mildenberger and Anthony Leiserowitz
Filed under: Beliefs & Attitudes, Policy & Politics and Climate Impacts
Public opinion can be a powerful influence on climate change policy and decision making – for mitigation, adaptation, justice, and equity. The Yale Climate Opinion Maps (YCOM) have provided state and local information about the US climate opinion since 2014, and we are pleased to release our latest update with data collected through 2021.
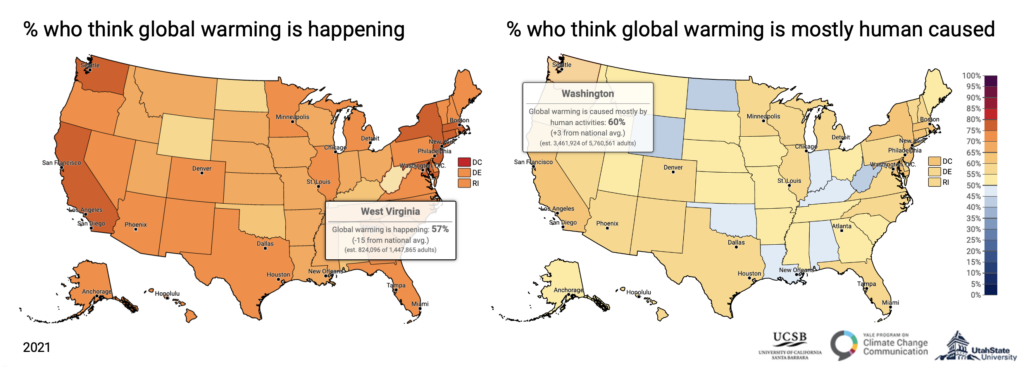
The YCOM 2021 maps depict geographic variation across 30 measures of climate change beliefs, risk perceptions, policy preferences, and behavior. The new maps show that large majorities in every state think global warming is happening and in most states (42), majorities think global warming is mostly human caused (Fig. 1). Yet, despite the fact that human activities are the dominant cause of global warming, many U.S. residents do not understand this fact.
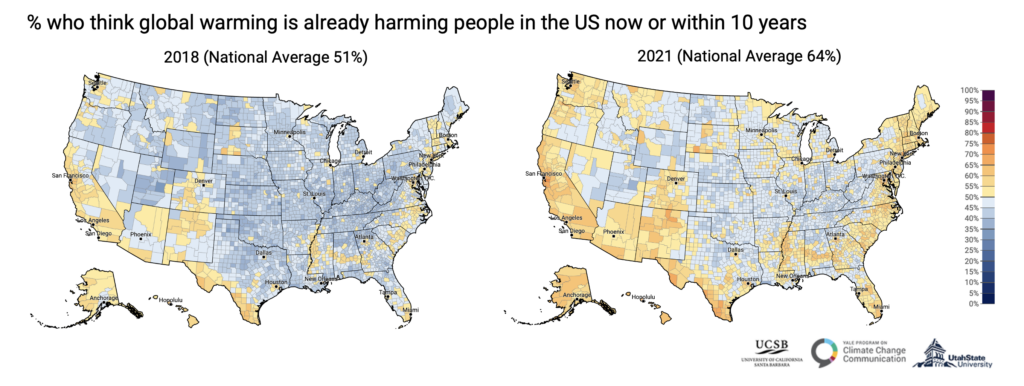
Comparisons between our YCOM 2018 and new YCOM 2021 maps (Fig. 2) illustrate an important shift in national and local climate change beliefs. For example, we find a substantial increase in the number of rural counties with majorities that think that global warming is already harming people in the US now or within the next 10 years, especially across northern states such as Oregon and Montana and along the Atlantic coast, including Florida and South Carolina.
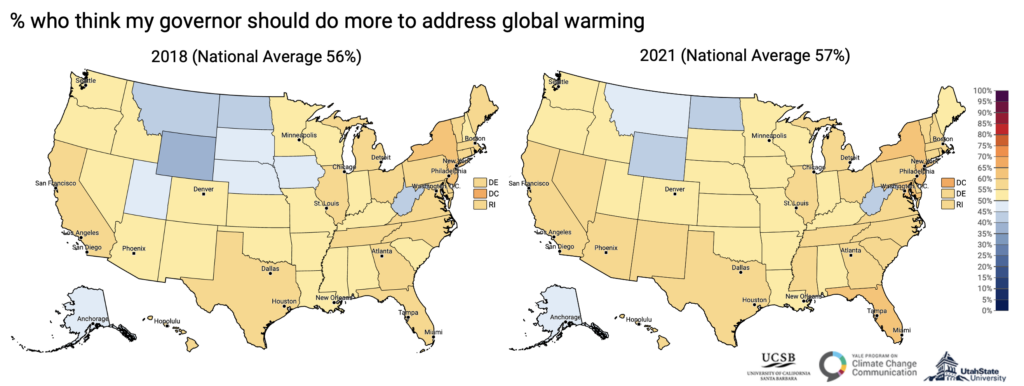
Our surveys have shown that support for climate policy has increased nationally, and the latest maps show where, at the state level, this is occurring. Four new states – Utah, South Dakota, Nebraska, and Iowa – now have majorities that want their own Governors to do more to address global warming (Fig. 3). Increasing incidents of extreme weather in communities across the country, including stronger storms, more uncontrollable wildfires, and more intense heat waves are likely a key factor in these opinion changes, but changes in leadership, political discourse, and media coverage are likely also important factors.
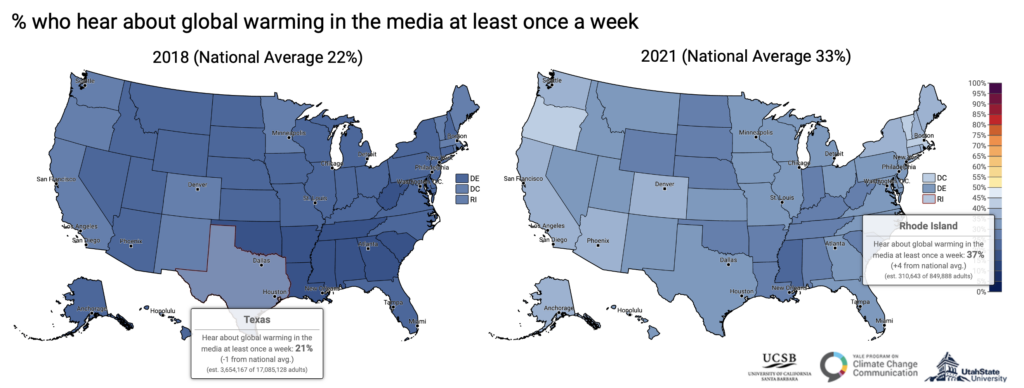
Media coverage in particular, has substantially increased over the past four years, moving from a national average of 22% of adults who say they hear about global warming in the media at least once a week in 2018, to 33% in 2021 (Fig. 4). Exposure to climate change media appears to have increased the most in northern states, including Oregon and New York (+14 percentage points), and Idaho, Maine, Vermont, and Washington (+13 pp). More residents of southern states including South Carolina, Georgia, and Tennessee, however, also say they are hearing about it more (+11 pp), since 2018.
We encourage you to visit the interactive maps for more details (2018 maps; 2021 maps)*. As you scroll down the page of the interactive maps you will find bar charts that show results for every question for any geographic location that you select.
We hope these new maps provide helpful context and insight about climate views in the US as you work to engage your own audiences on this vital issue over the coming weeks and months. Please stay tuned for more comprehensive analyses of subnational changes over time in the coming months.
* Please note that while we produced maps in other years for YCOM, the underlying model has changed over time, so we discourage direct comparisons between specific counties and years, but regional differences in the maps between years can reveal broader trends. We are currently in the process of creating robust time series for all years, so please stay tuned for more change-over-time data at subnational scales.