Climate Note · Apr 8, 2025
Factsheets Tool for Public Opinion on Climate Change in Countries Around the World
By Andrew Gillreath-Brown, Adán Rivas, Martial Jefferson, Jennifer Carman, Emily Goddard, Leah Ndumi Kioko, Eric Fine, Seth Rosenthal, Anthony Leiserowitz and Jennifer Marlon
Filed under: Beliefs & Attitudes, Policy & Politics and Audiences
Public opinion influences decision-making at every level—from personal behaviors and community norms to policy priorities and global commitments. Individual beliefs and attitudes ripple outward, influencing social expectations, electoral outcomes, corporate strategies, and ultimately the scope and ambition of climate action.
To support better national decision-making and global collaboration, the Yale Program on Climate Change Communication has created factsheets that describe public climate change and energy knowledge, attitudes, policy support, and behavior in countries around the world.
The new Global Climate Opinion Factsheets tool includes eight key measures of public climate change knowledge, risk perceptions, policy support, and Climate Change’s Six Audiences for 107 countries and territories and from three geographic groups (i.e., Asian & Pacific Islands, Other Caribbean, and Other Sub-Saharan Africa) encompassing 80 countries and territories (for a total of 110 “areas”), providing unprecedented insight into national climate opinions worldwide. The underlying survey was conducted in partnership with Data for Good at Meta and Rare’s Center for Behavior and the Environment August 3 to September 3, 2023 among Facebook users in countries and territories around the world.
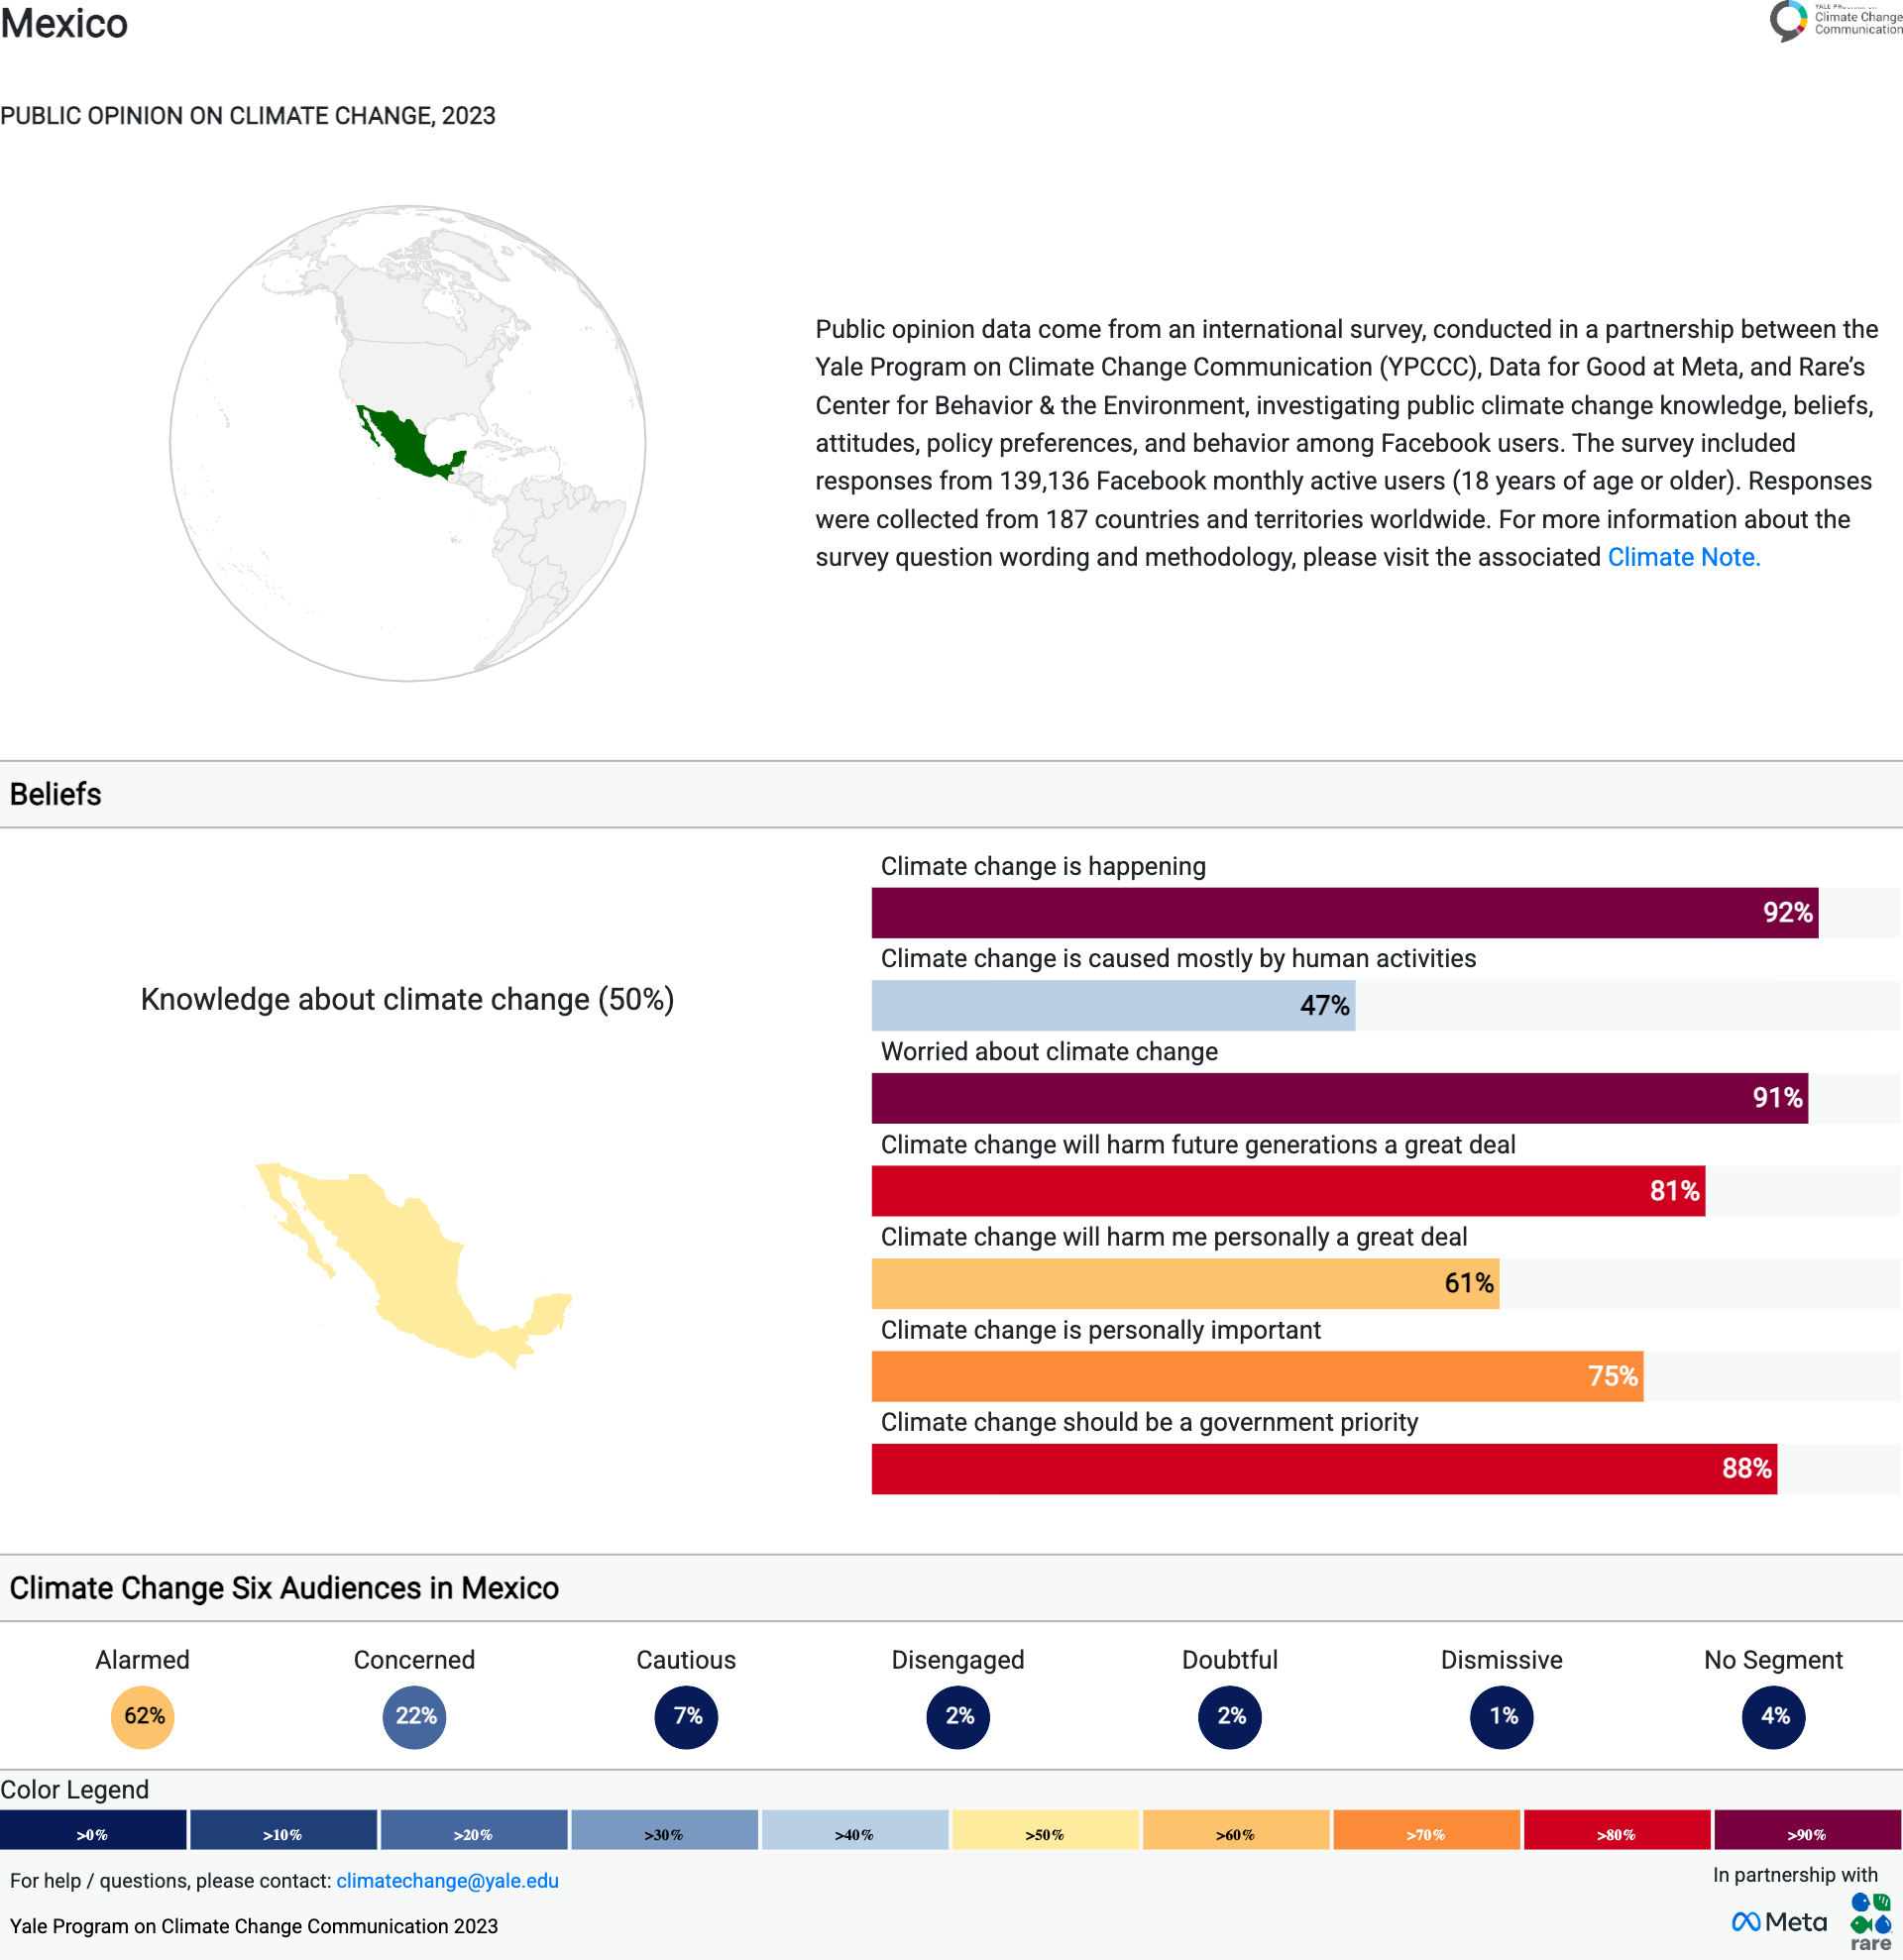
The online tool allows you to tailor a factsheet by selecting a particular country or territory and the specific measures of interest. Factsheets can be saved as a PDF or printed for distribution to classes, community members, the media, business leaders, or government officials. A factsheet for a specific location can also be shared via a URL link, for example: the factsheet for Mexico. Select either a country/territory or geographic group; select the opinions you are most interested in, then click “Generate” to get a customized factsheet on climate change opinions in that location.
Methods
The factsheets data are based on a survey of 139,136 Facebook monthly active users aged 18 and older, conducted from August 3 to September 3, 2023. Users were invited via their Facebook News Feed and could choose to complete the survey on the platform. The sample was drawn proportionally to age and gender benchmarks in each country or territory, with smaller populations combined into regional groups due to limited benchmark data. A total of 187 countries and territories were included in the study, with 80 smaller sample size countries and territories combined into three geographic groups—Other Caribbean, Asian and Pacific Islands, and Other Sub-Saharan Africa. As a result, all countries and territories within each of these three groups share the same reported percentages within their groups, rather than having distinct country-level results. For example, in the Caribbean, Sint Maarten, Suriname, and Turks and Caicos Islands will have the same reported levels since they were combined. The United Nations Population Division (2019) and U.S. Census Bureau (2018) provided population reference data. A multi-stage weighting process was applied to ensure national representativeness, incorporating census data, survey benchmarks, Facebook demographics, and engagement metrics.
Results are provided at the national level only. We have previously provided sub-national results in selected countries where we have sub-national Yale Climate Opinion Maps estimates (e.g., India factsheets, U.S. factsheets, Ireland, and Canada). These studies were based on in-depth, nationally representative surveys using different survey and analysis methodologies, so results may differ slightly. Nonetheless, the global factsheets tool provides national-level results using an identical set of questions across all countries.
Survey Questions and Responses
Percentages in the factsheets were derived from public responses to the following survey questions. The response categories for many questions were combined into a single category. For example, for the question measuring how worried respondents are about climate change, “very worried” and “somewhat worried” were combined into a single measure of “worried.” The complete list of survey questions and combined responses are provided in the table below. The full set of responses are available for each country and territory in the original International Public Opinion on Climate Change, 2023 report.
| Question | Bucketed Responses |
|---|---|
| How much do you know about climate change? | “I know a lot about it” and “I know a moderate amount about it” |
| What do you think: Do you think that climate change is happening? | “Yes” |
| Assuming climate change is happening, do you think it is… | “Caused mostly by human activities” |
| How worried are you about climate change? | “Very worried” and “Somewhat worried” |
| How much do you think climate change will harm future generations of people? | “A great deal” |
| How much do you think climate change will harm you personally? | “A great deal” |
| How important is the issue of climate change to you personally? | “Extremely important” and “Very important” |
| Do you think climate change should be a very high, high, medium, or low priority for the government of the country or territory where you live? | “Very high” and “High” |
Rounding Error and Tabulation
Percentages are weighted based on general population parameters for each surveyed country and territory.
For tabulation purposes, percentage points are rounded to the nearest whole number. As a result, percentages in a given chart may total slightly higher or lower than 100%. Summed response categories (e.g., “a lot” + “a moderate amount”) are rounded after sums are calculated (e.g., 25.3% + 25.3% = 50.6%, which, after rounding, would be reported as 25% + 25% = 51%).
Sample Sizes for Surveyed Countries, Territories, and Groups
Our study collected data from a total of 187 countries and territories, including 80 countries and territories that were combined into three geographic groups due to sample size (i.e., Other Caribbean, Asian & Pacific Islands, and Other Sub-Saharan Africa). The unweighted sample sizes for each country, territory, and geographic group are presented in the following table.
| Country, Territory, or Geographic Group | Sample Size |
|---|---|
| Albania | 531 |
| Algeria | 1791 |
| Angola | 1037 |
| Argentina | 1682 |
| Armenia | 549 |
| Asian & Pacific Islands* | 2649 |
| Australia | 936 |
| Austria | 1157 |
| Azerbaijan | 842 |
| Bangladesh | 1642 |
| Belgium | 1027 |
| Benin | 863 |
| Bolivia | 1571 |
| Bosnia and Herzegovina | 659 |
| Botswana | 774 |
| Brazil | 1526 |
| Bulgaria | 1515 |
| Burkina Faso | 745 |
| Côte d'Ivoire | 927 |
| Cambodia | 1007 |
| Cameroon | 839 |
| Canada | 1010 |
| Chile | 1192 |
| Colombia | 1658 |
| Congo DRC | 804 |
| Costa Rica | 1469 |
| Croatia | 669 |
| Cyprus | 571 |
| Czech Republic | 1104 |
| Denmark | 1020 |
| Dominican Republic | 1295 |
| Ecuador | 1443 |
| Egypt | 1932 |
| El Salvador | 1334 |
| Finland | 631 |
| France | 1497 |
| Germany | 2023 |
| Ghana | 816 |
| Greece | 1024 |
| Guatemala | 1602 |
| Haiti | 771 |
| Honduras | 1490 |
| Hong Kong | 467 |
| Hungary | 620 |
| India | 3793 |
| Indonesia | 1767 |
| Iraq | 2185 |
| Ireland | 1080 |
| Israel | 988 |
| Italy | 1093 |
| Jamaica | 603 |
| Japan | 1116 |
| Jordan | 2086 |
| Kenya | 1892 |
| Kosovo | 522 |
| Kuwait | 906 |
| Laos | 745 |
| Lebanon | 1049 |
| Libya | 1168 |
| Lithuania | 1301 |
| Malawi | 1092 |
| Malaysia | 1805 |
| Mexico | 1700 |
| Morocco | 1347 |
| Mozambique | 961 |
| Nepal | 1534 |
| Netherlands | 927 |
| New Zealand | 1029 |
| Nicaragua | 820 |
| Nigeria | 1939 |
| North Macedonia | 693 |
| Norway | 1134 |
| Oman | 483 |
| Other Caribbean* | 1383 |
| Other Sub-Saharan Africa* | 4805 |
| Pakistan | 1966 |
| Panama | 852 |
| Paraguay | 825 |
| Peru | 1455 |
| Philippines | 1825 |
| Poland | 897 |
| Portugal | 948 |
| Puerto Rico | 872 |
| Qatar | 835 |
| Romania | 1264 |
| Saudi Arabia | 1440 |
| Senegal | 704 |
| Serbia | 1309 |
| Singapore | 378 |
| Slovakia | 1050 |
| South Africa | 1547 |
| South Korea | 1038 |
| Spain | 912 |
| Sri Lanka | 1266 |
| Sweden | 1299 |
| Switzerland | 1007 |
| Taiwan | 1736 |
| Tanzania | 809 |
| Thailand | 2299 |
| Trinidad and Tobago | 539 |
| Tunisia | 1948 |
| Turkiye | 1733 |
| United Arab Emirates | 1271 |
| United Kingdom | 1969 |
| United States of America | 2836 |
| Uruguay | 944 |
| Uzbekistan | 1194 |
| Vietnam | 1564 |
| Yemen | 1069 |
| Zambia | 879 |
*The 80 countries and territories were combined into three geographic groups (Asian & Pacific Islands [n = 2,649], Other Caribbean [n = 1,383], and Other Sub-Saharan Africa [n = 4,805]), which are presented in the following table.
| Geographic Group | Country or Territory |
|---|---|
| Asian & Pacific Islands | American Samoa |
| Asian & Pacific Islands | Brunei Darussalam |
| Asian & Pacific Islands | Cabo Verde |
| Asian & Pacific Islands | Comoros |
| Asian & Pacific Islands | Cook Islands |
| Asian & Pacific Islands | Fiji |
| Asian & Pacific Islands | French Polynesia |
| Asian & Pacific Islands | Guam |
| Asian & Pacific Islands | Guinea-Bissau |
| Asian & Pacific Islands | Kiribati |
| Asian & Pacific Islands | Maldives |
| Asian & Pacific Islands | Marshall Islands |
| Asian & Pacific Islands | Mauritius |
| Asian & Pacific Islands | Mayotte |
| Asian & Pacific Islands | Micronesia |
| Asian & Pacific Islands | Nauru |
| Asian & Pacific Islands | New Caledonia |
| Asian & Pacific Islands | Northern Mariana Islands |
| Asian & Pacific Islands | Palau |
| Asian & Pacific Islands | Papua New Guinea |
| Asian & Pacific Islands | Réunion |
| Asian & Pacific Islands | Samoa |
| Asian & Pacific Islands | Sao Tome and Principe |
| Asian & Pacific Islands | Seychelles |
| Asian & Pacific Islands | Solomon Islands |
| Asian & Pacific Islands | Timor-Leste |
| Asian & Pacific Islands | Tonga |
| Asian & Pacific Islands | Tuvalu |
| Asian & Pacific Islands | United States Minor Outlying Islands |
| Asian & Pacific Islands | Vanuatu |
| Asian & Pacific Islands | Wallis and Futuna |
| Other Caribbean | Anguilla |
| Other Caribbean | Antigua and Barbuda |
| Other Caribbean | Aruba |
| Other Caribbean | Bahamas |
| Other Caribbean | Barbados |
| Other Caribbean | Belize |
| Other Caribbean | Bermuda |
| Other Caribbean | Bonaire |
| Other Caribbean | British Virgin Islands |
| Other Caribbean | Cayman Islands |
| Other Caribbean | Curacao |
| Other Caribbean | Dominica |
| Other Caribbean | French Guiana |
| Other Caribbean | Grenada |
| Other Caribbean | Guadeloupe |
| Other Caribbean | Guyana |
| Other Caribbean | Martinique |
| Other Caribbean | Saint Kitts and Nevis |
| Other Caribbean | Saint Lucia |
| Other Caribbean | Saint Martin |
| Other Caribbean | Saint Vincent and the Grenadines |
| Other Caribbean | Sint Maarten |
| Other Caribbean | Suriname |
| Other Caribbean | Turks and Caicos Islands |
| Other Caribbean | US Virgin Islands |
| Other Sub-Saharan Africa | Burundi |
| Other Sub-Saharan Africa | Central African Republic |
| Other Sub-Saharan Africa | Chad |
| Other Sub-Saharan Africa | Congo |
| Other Sub-Saharan Africa | Djibouti |
| Other Sub-Saharan Africa | Equatorial Guinea |
| Other Sub-Saharan Africa | Eswatini |
| Other Sub-Saharan Africa | Ethiopia |
| Other Sub-Saharan Africa | Gabon |
| Other Sub-Saharan Africa | Gambia |
| Other Sub-Saharan Africa | Guinea |
| Other Sub-Saharan Africa | Lesotho |
| Other Sub-Saharan Africa | Liberia |
| Other Sub-Saharan Africa | Madagascar |
| Other Sub-Saharan Africa | Mali |
| Other Sub-Saharan Africa | Mauritania |
| Other Sub-Saharan Africa | Namibia |
| Other Sub-Saharan Africa | Niger |
| Other Sub-Saharan Africa | Rwanda |
| Other Sub-Saharan Africa | Sierra Leone |
| Other Sub-Saharan Africa | Somalia |
| Other Sub-Saharan Africa | South Sudan |
| Other Sub-Saharan Africa | Togo |
| Other Sub-Saharan Africa | Uganda |
| Other Sub-Saharan Africa | Zimbabwe |