Report · Oct 3, 2023
Climate Change in the Indonesian Mind
By Anthony Leiserowitz, Seth Rosenthal, Marija Verner, Sanguk Lee, Matthew Ballew, Jennifer Carman, Matthew Goldberg, Jennifer Marlon, Enggar Paramita, Mardiyah Chamim, Paramita Mohamad and Matthew Daggett
Filed under: Behaviors & Actions and Beliefs & Attitudes
Appendix I: Methods
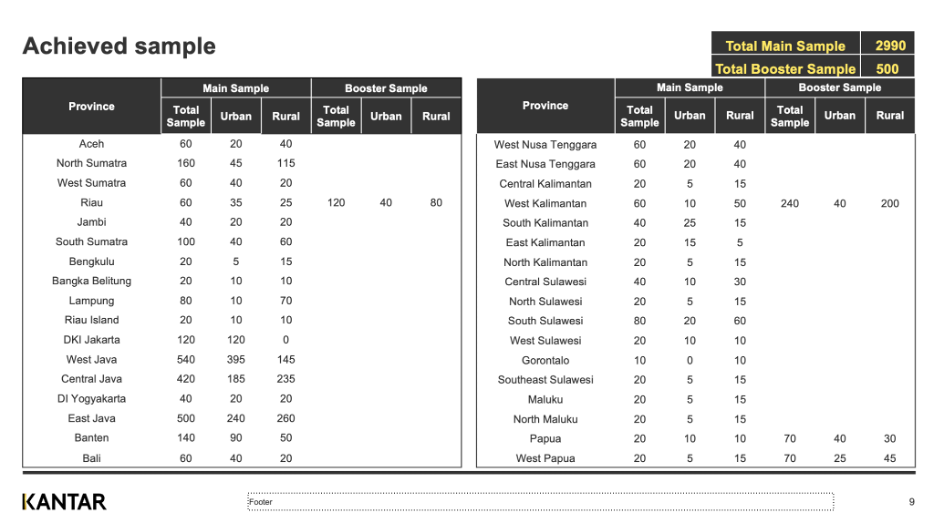
This report is based on findings from a nationally representative survey of individuals in Indonesia (aged 16 years and above) conducted by Development Dialogue Asia, the Yale Program on Climate Change Communication, Communication for Change, and Kantar Indonesia, an international survey company headquartered in Jakarta, Indonesia. Using the probability proportional to size sampling method, sampling points (Kecamatan) were randomly selected across all 34 provinces in Indonesia. In each selected sampling point (Kecamatan), households were randomly selected, and one respondent was randomly selected within each household. Respondents were recruited to participate in the questionnaire in-person, via door-to-door household interviews that occurred seven days per week (from 7 a.m. – 7 p.m.) from June 7 – July 30, 2021. Interviews were conducted in person using Computer Aided Self Interviewing (CASI) via a tablet device. The initial screening questionnaire was conducted by the interviewers, and the main questionnaire was self-administered offline by respondents using the interviewers’ tablet device. National Census-based demographic parameters were used to create sampling targets. The main sample was divided into urban and rural in each province. The proportion of urban and rural was obtained from the urban and rural proportion of the particular province based on 2010 Population Census data. The sample was weighted after completion of the data collection to adjust the final sample to match national demographic parameters. Interviews: 3,490 adults. Average margin of error: +/- 1.7 percentage points at the 95% confidence level.
In the data tables, bases specified are unweighted while percentages are weighted to match national population parameters. For tabulation purposes, percentage points are rounded to the nearest whole number. As a result, percentages in a given chart may total slightly higher or lower than 100%. Summed response categories (e.g., “strongly agree” + “somewhat agree”) are rounded after sums are calculated. For example, in some cases, the sum of 25% + 25% might be reported as 51% (e.g., 25.3% + 25.3% = 50.6%, which, after rounding, would be reported as 25% + 25% = 51%).
The survey instrument was designed by Enggar Paramita and Mardiyah Chamim of Development Dialogue Asia; Matthew Daggett; Paramita Mohamad of Communication for Change; and Anthony Leiserowitz, Seth Rosenthal, Jennifer Carman, and Jennifer Marlon of Yale University. This report was written by Matthew Ballew, Marija Verner, Seth Rosenthal, Jennifer Carman, and Anthony Leiserowitz of Yale University; Enggar Paramita of Development Dialogue Asia; and Matthew Daggett. Data analyses were conducted by Matthew Ballew, Marija Verner, Sanguk Lee, and Seth Rosenthal of Yale University. All graphics (including charts and tables) in this report were created by Sanguk Lee, Marija Verner, Matthew Ballew, and Liz Neyens of Yale University.