Climate Note · Aug 6, 2024
Variations in climate opinions across India
By Jennifer Marlon, Anthony Leiserowitz, Jagadish Thaker, Emily Goddard, Liz Neyens, Swetha Kolluri, Seth Rosenthal, Jennifer Carman and Naga Raghuveer Modala
Filed under: Beliefs & Attitudes and Climate Impacts

India is among the countries most vulnerable to the impacts of climate change. It has long been a key player in international climate negotiations and has begun implementing a diverse portfolio of policies nationally and within individual states to improve energy efficiency, develop clean energy sources, and prepare for the impacts of a changing climate. About 33 States and Union Territories have also announced state-level action plans to address climate change. Our recent national survey in India indicates that large majorities are worried about climate-related hazards, including severe heat waves (85%), droughts and water shortages (85%), and severe cyclones and floods (76% and 71%, respectively).
Prior studies of public responses to climate change in India have often provided results only at the national level. For example, our recent national survey in India found that large majorities in India are worried about climate-related hazards, but until now we had little information about the diversity of climate opinions within the country. To better understand how opinions vary across India, we are pleased to present a new pioneering analysis and online interactive tool: Yale Climate Opinion Maps for India. For the first time, this tool provides estimates of public responses to climate change in 34 of India’s 36 states and Union territories, and in 604 districts, depicting the variation in global warming knowledge, beliefs, risk perceptions, and policy preferences at the state and local level across the country (see Methods below).
Key takeaways from the research are:
- Large majorities of Indians in all of India’s states and districts are worried about global warming.
- Large majorities in every district across India think global warming will cause more severe heat waves.
- Majorities in 98% of districts think that India should use less fossil fuels in the future.
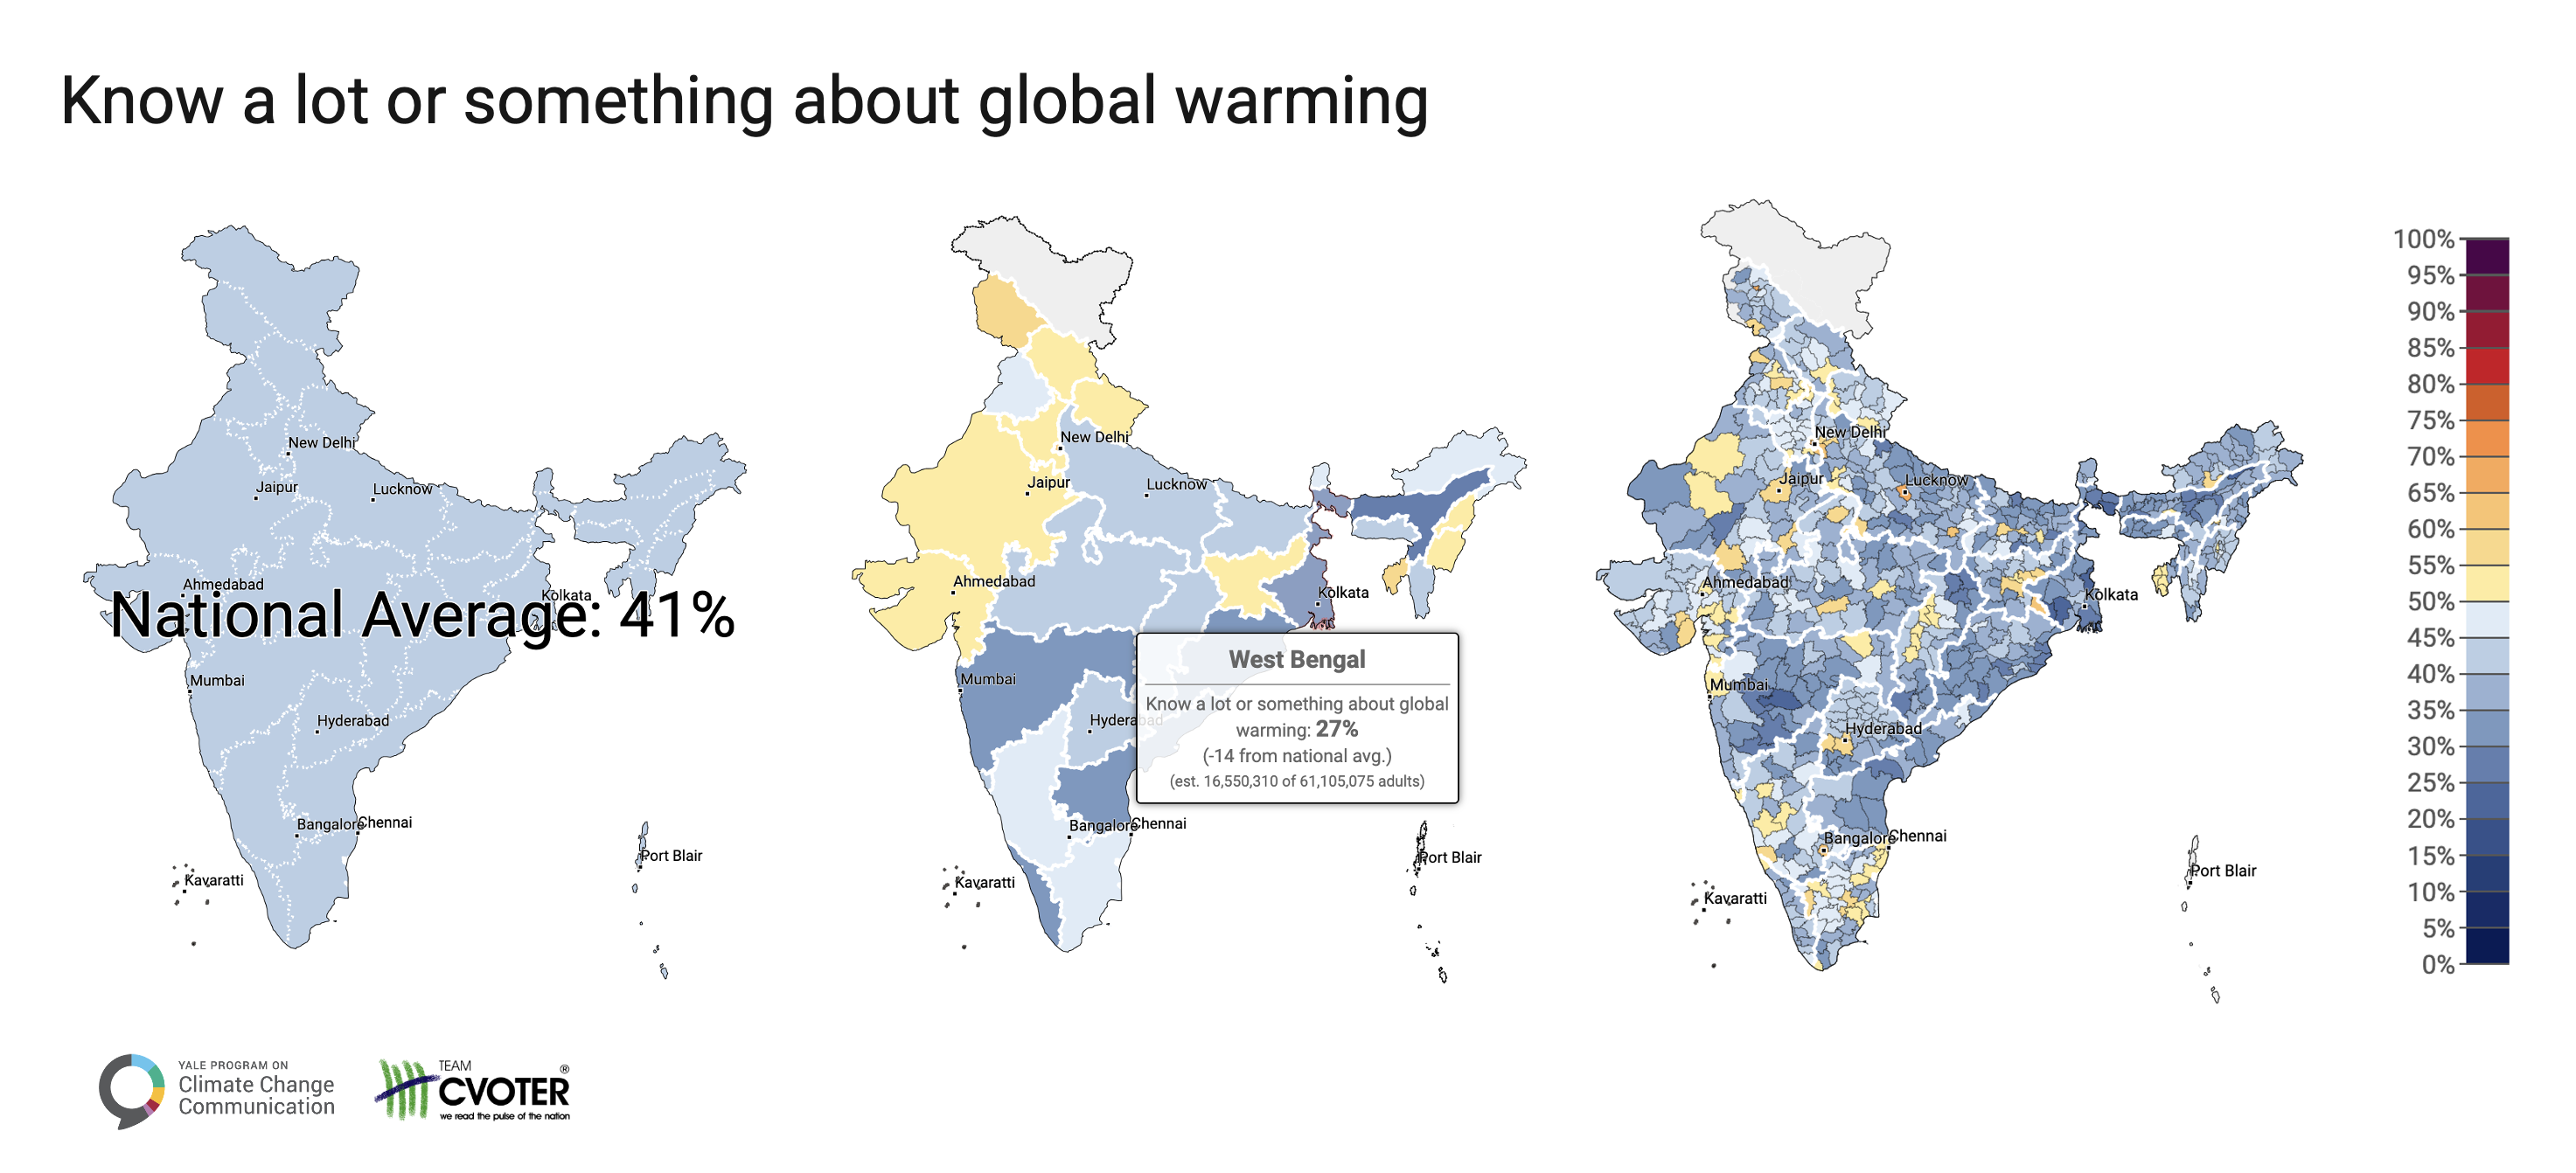
Figure 1. Maps of global warming knowledge in India. Nationally (left), 41% of people in India say they know a lot or something about global warming, but there are strong variations across states and Union territories (e.g., in West Bengal only 27% know something or a lot about global warming (middle) versus 51% in Rajasthan), and districts (right).
For example, while 41% of Indians nationally say they know a lot or something about global warming, there is substantial geographic variation across the country (Fig. 1). In Gujarat, 52% of Indians know a lot or something about the issue, whereas in Maharashtra, only 33% report this level of knowledge. More Indians living in state capital cities say they know a lot or something about global warming compared to other districts.
After being asked about their level of knowledge about global warming, respondents were given a short definition: “Global warming refers to the idea that the world’s average temperature has been increasing over the past 150 years, may be increasing more in the future, and that the world’s climate and weather patterns may change as a result.” They were then asked questions about whether global warming is happening, what risks they perceived, and what policies they support or oppose.
After receiving the brief explanation, 82% of people in India think it is happening, but only 54% think that it is caused “mostly by human activities” rather than “mostly by natural changes in the environment,” (38%) by other causes, don’t know, or think global warming is not happening (Fig. 2). Thus, there is a large gap between public understanding of the causes of climate change in India and the international scientific consensus, which unequivocally attributes global warming to human activities. But we also find great variation within the country, with some districts like Thiruvananthapuram, Kerala (68%) with a large majority who understand global warming is human-caused, while in other districts, like Kheri, Uttar Pradesh (43%), only a minority of people understand the cause.
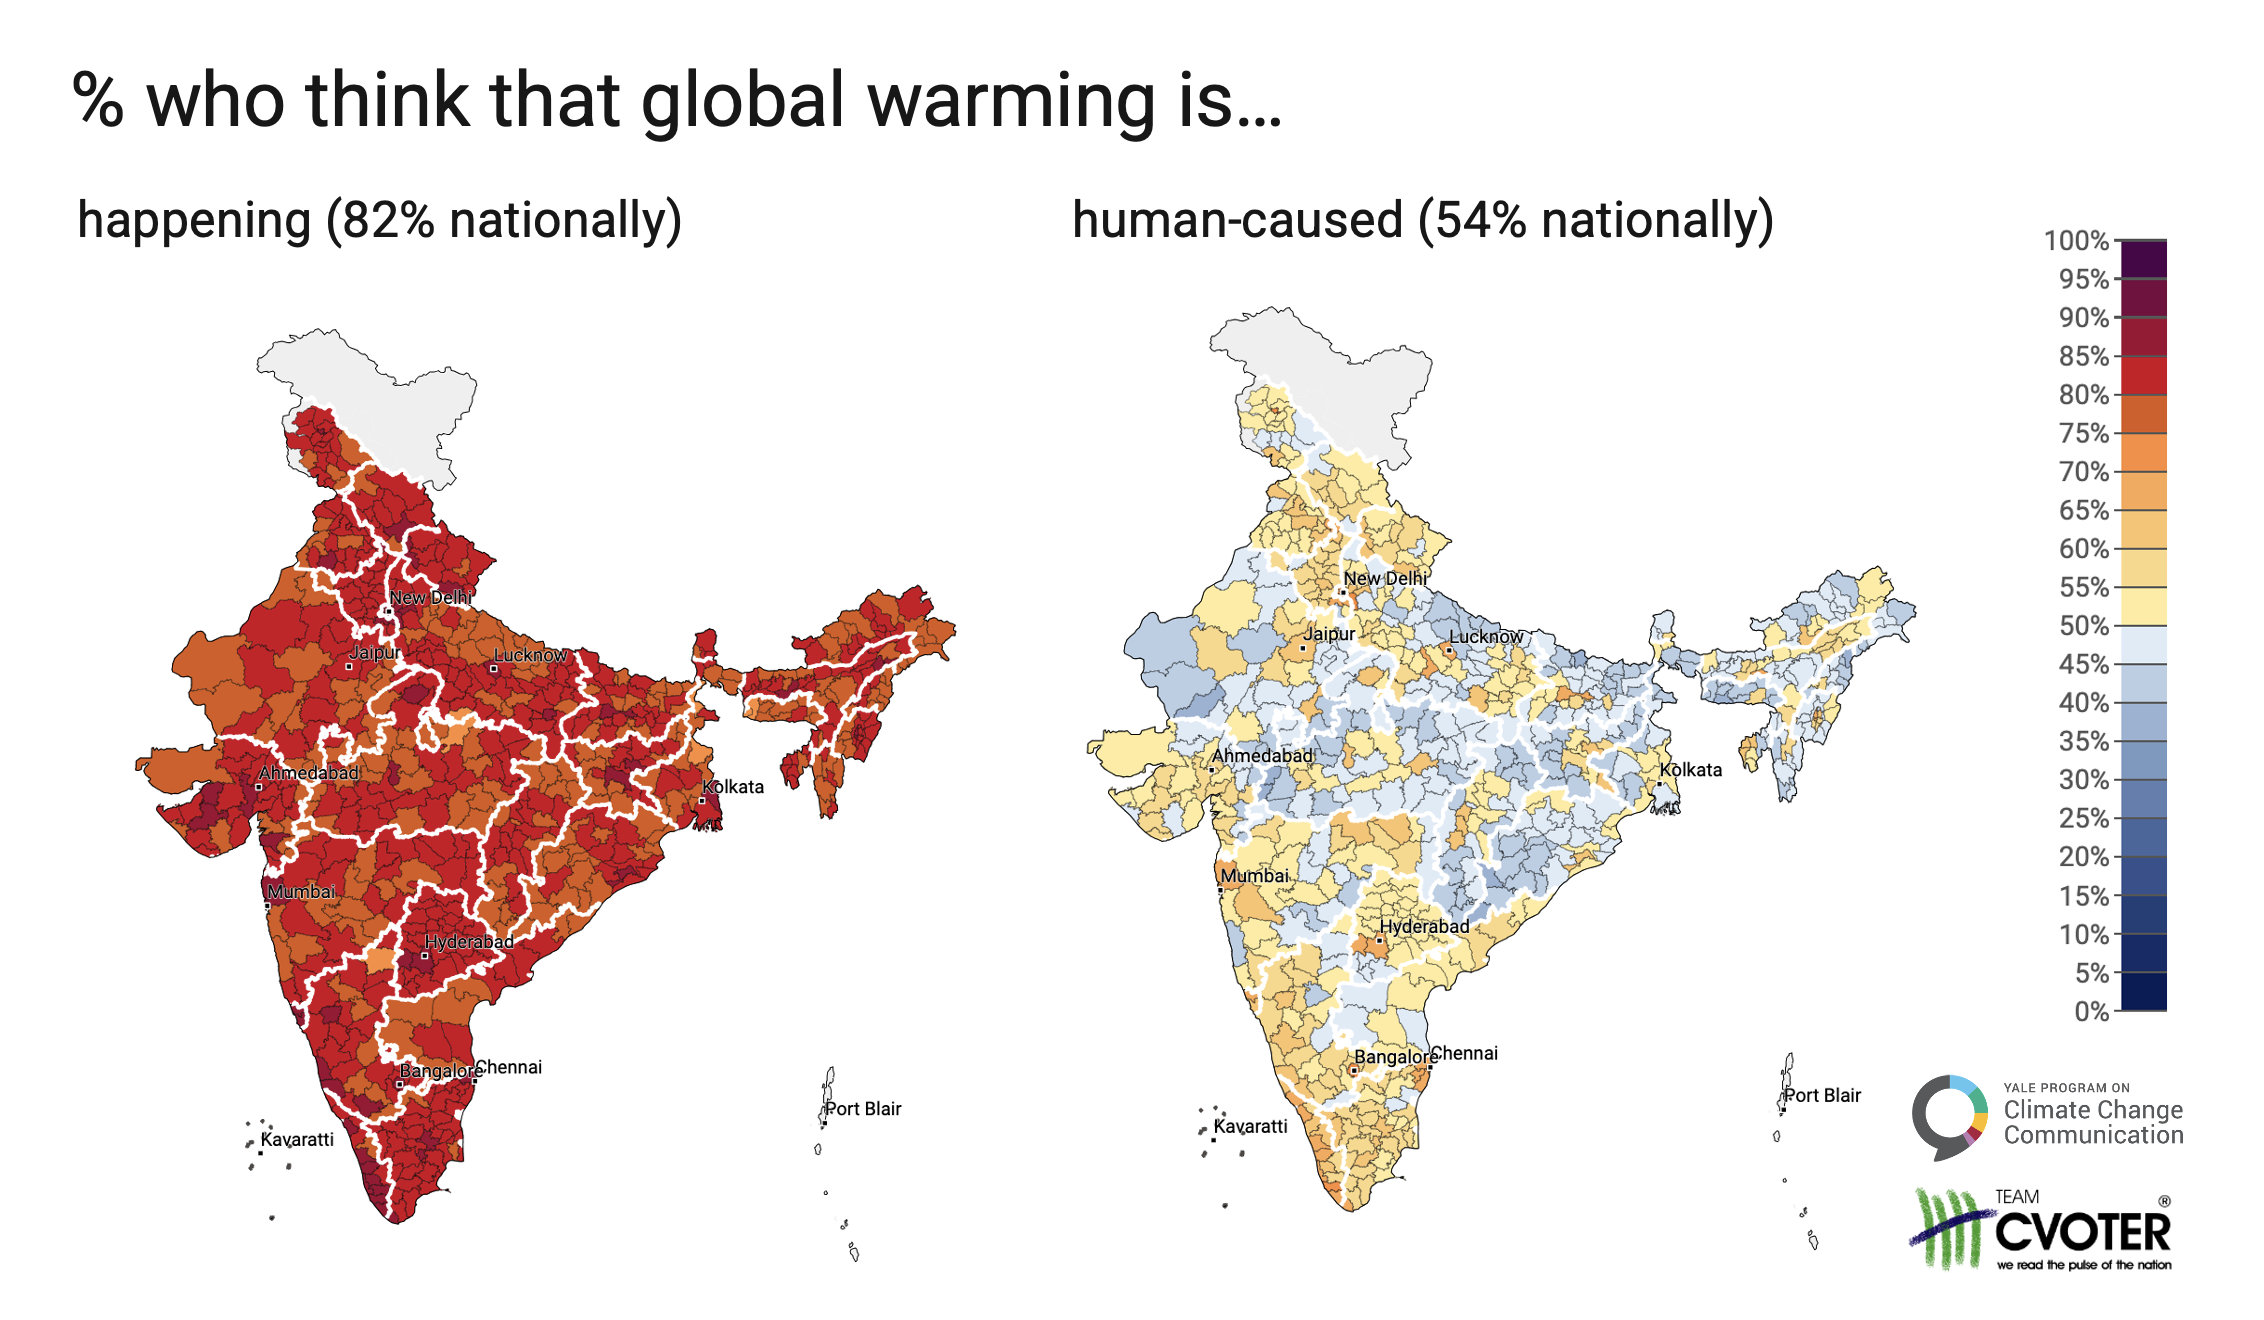
Figure 2. Maps depicting district-level spatial variations in the percentage of people in each district in India who think global warming is happening (left) and human caused (right). Nationally, 82% think global warming is happening whereas 54% think it is human-caused.
Climate change is affecting people everywhere. In the United States, however, only 44% of residents say they have personally experienced the effects of global warming (Fig. 3). In contrast, 78% of Indians report that they have personally experienced the effects. However, this varies by 41 percentage points across the country at the state level, ranging from 90% in Haryana to 49% in Andhra Pradesh. In general, people in northern India are more likely to report personal experience with global warming than people in southern states.
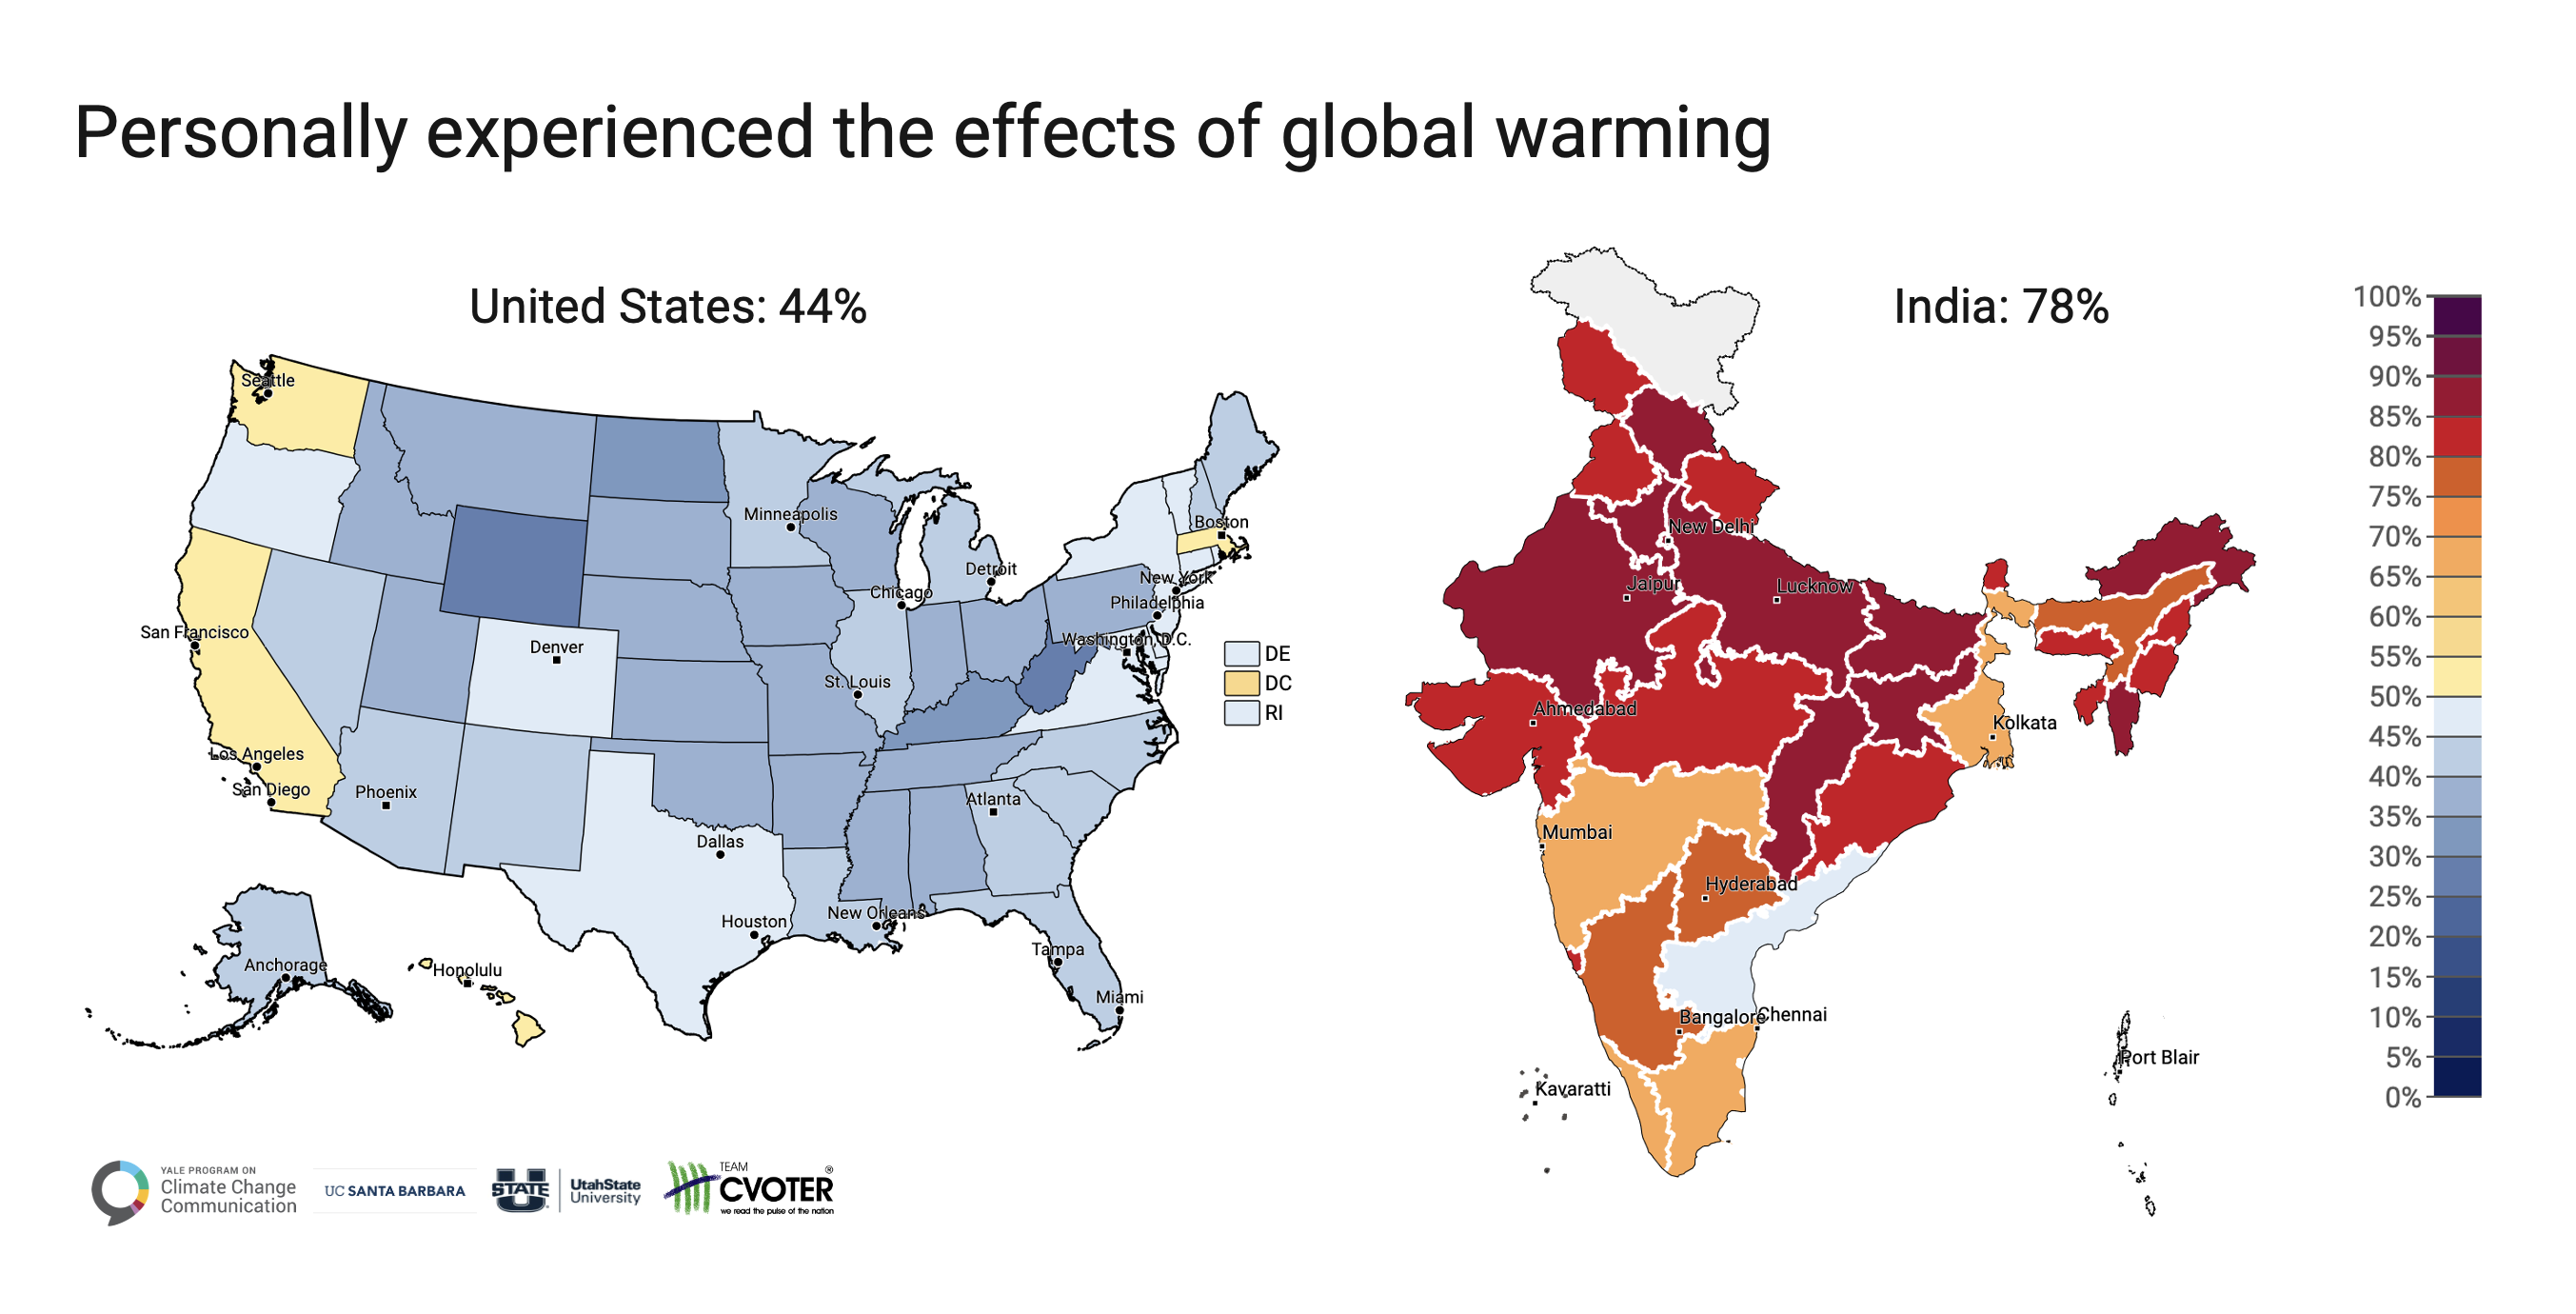
Figure 3. Maps depicting state-level spatial variations in the United States (left) and India (right) in the percentage of people who say they have reported personally experiencing the effects of global warming. Nationally, 44% of people in the US say they have personally experienced the effects of global warming, whereas 78% of people in India say this.
In contrast to personal experience with global warming, risk perceptions of the harms are relatively more consistent from state to state and district to district. Nationally, 85% of Indians are worried about global warming , while 74% think global warming will worsen heat waves. (Fig. 4). More Indians perceive risks from global warming in places like Kerala, Goa, and Punjab, compared to states such as Karnataka and Tamil Nadu.
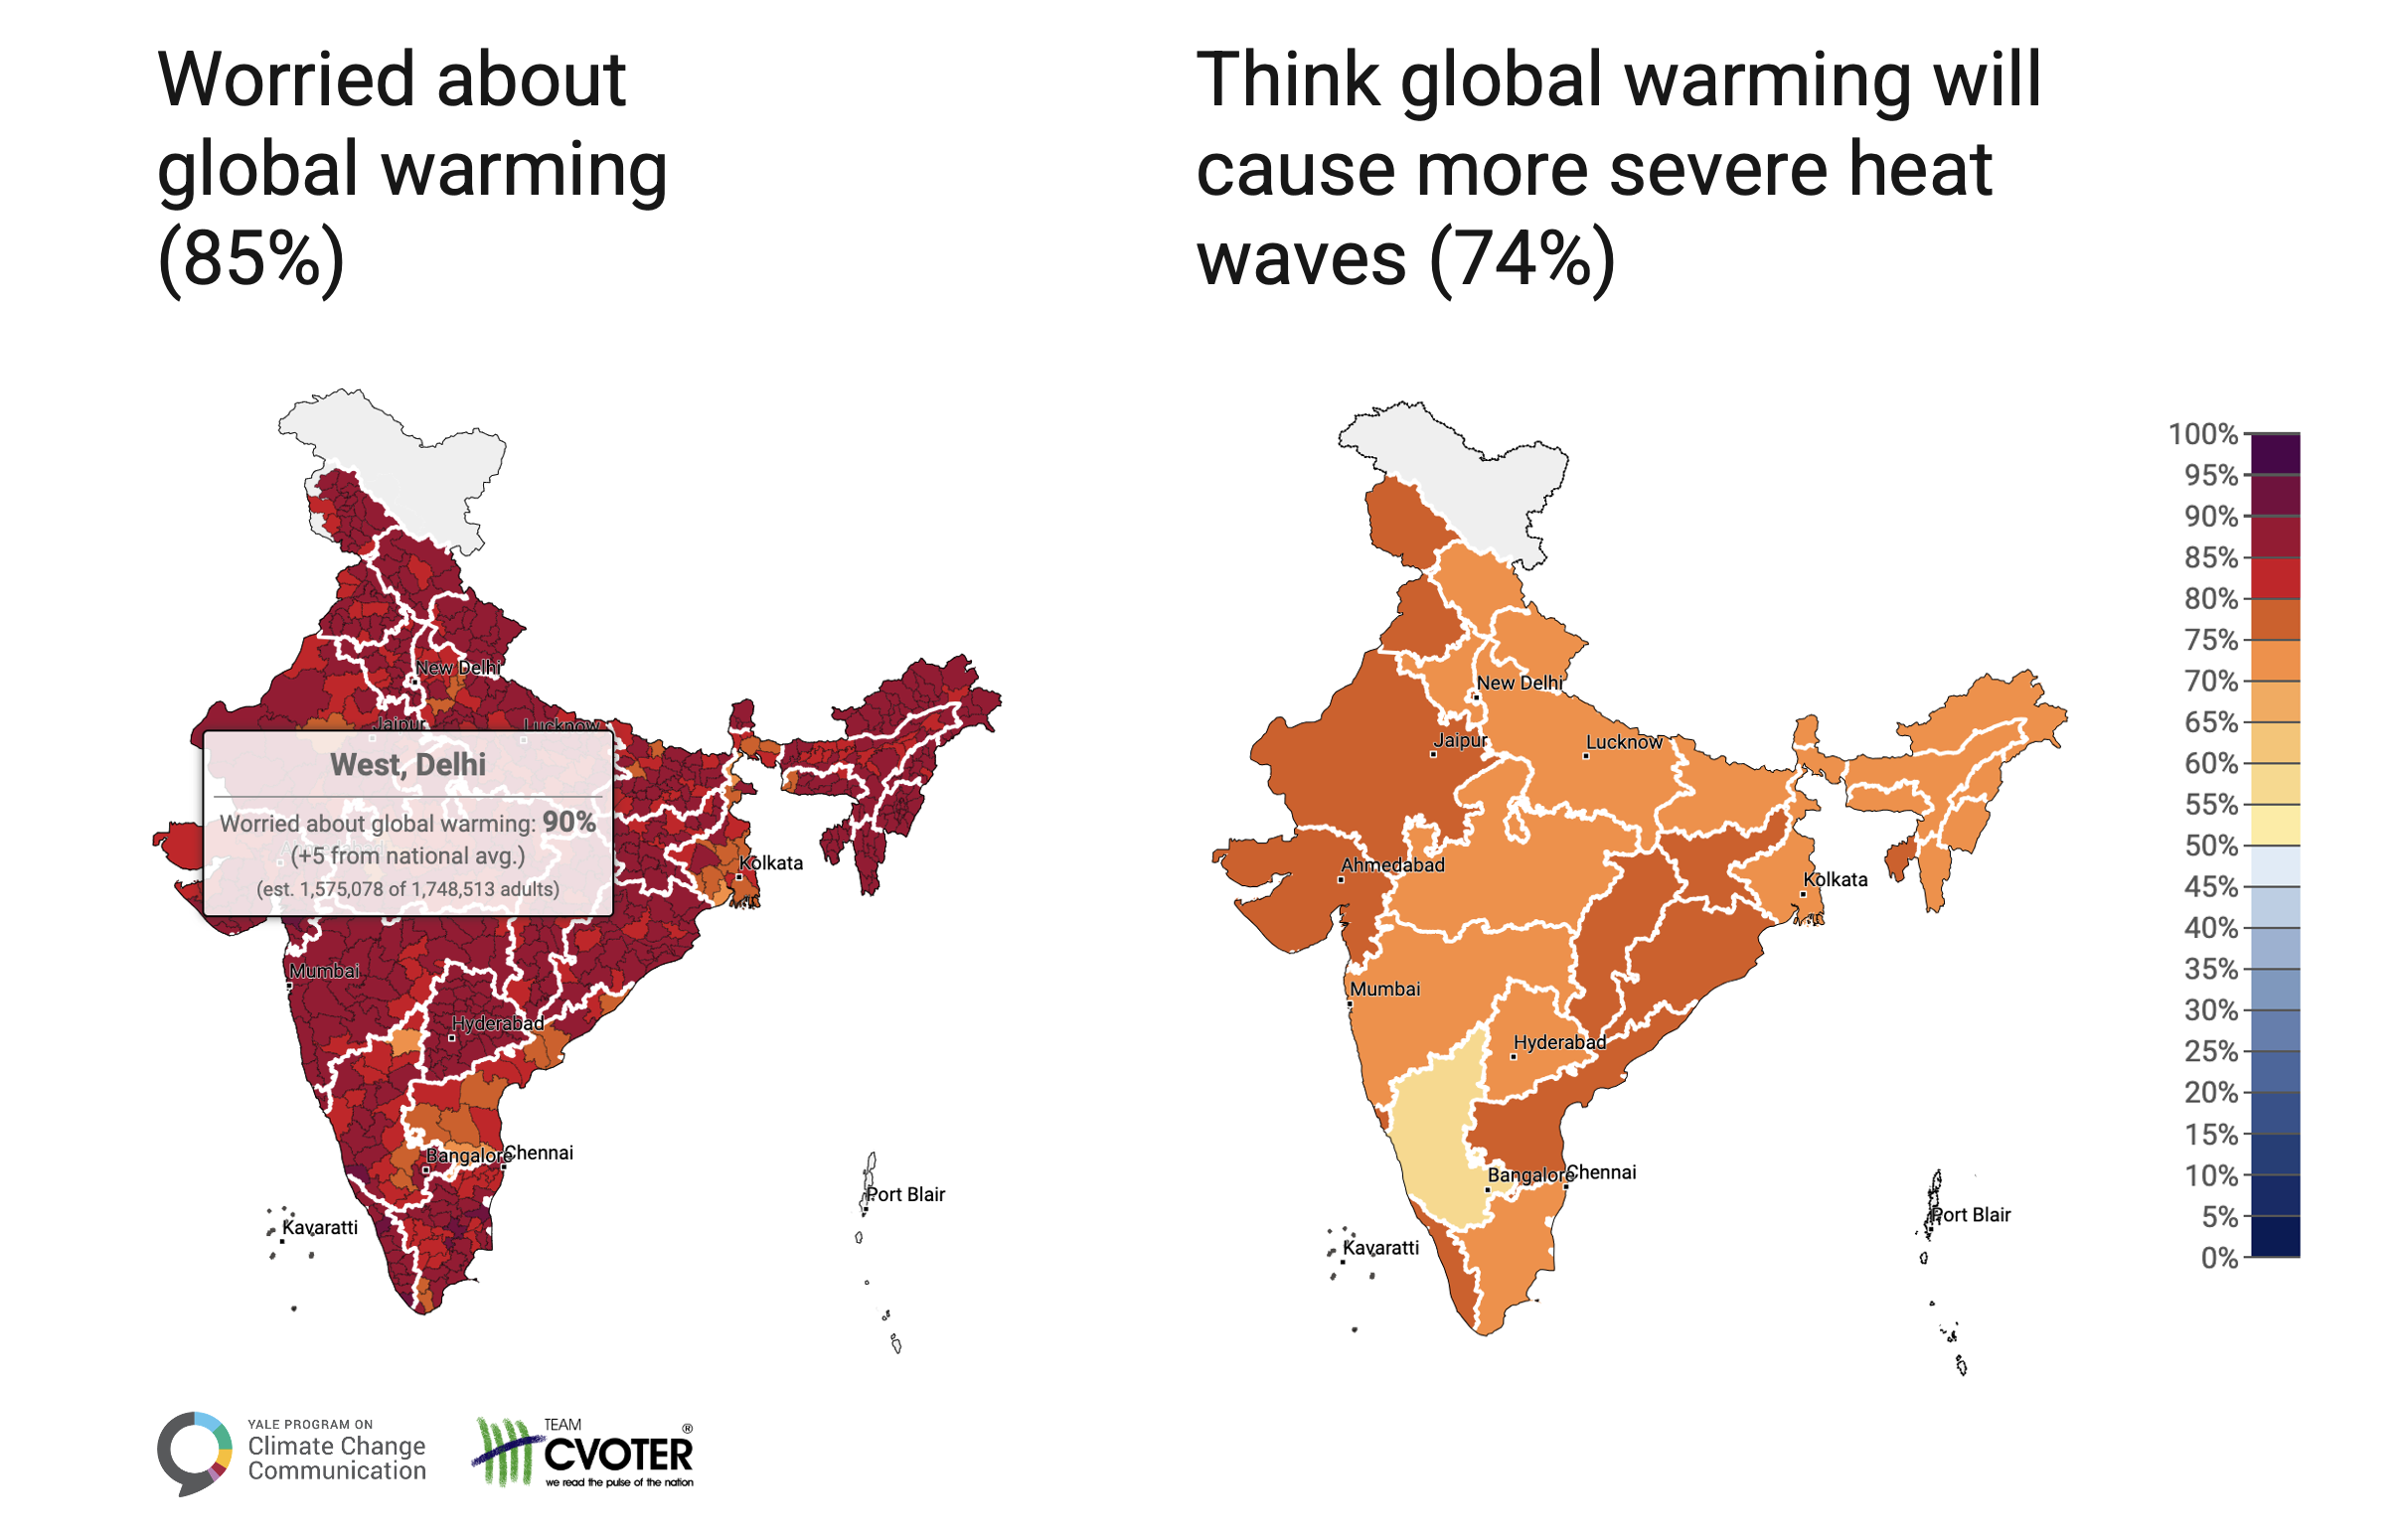
Figure 4. Spatial variations in global warming risk perceptions across India. Nationally, 85% of people in India say they are very or somewhat worried about global warming (left). Risk perceptions of heat specifically, however, are slightly lower, with 74% of people in India saying they think global warming will cause more severe heat waves (right).
Climate change impacts are different in different parts of India. For example, drought is most common in the northwest, whereas flooding poses a greater threat in the east. Cyclones, drought, and flooding are all important risks in the south. Large majorities in every Indian state think global warming will cause more severe cyclones, droughts and water shortages. Plant and animal extinctions are also widely perceived as a risk of global warming (70%), in addition to more famines and food shortages (64%). Nationally, more people think global warming will cause more severe heat waves, but in some states, like Punjab, flooding is a much greater concern (80%) as compared to other states.
Finally, we find broad support for policies that transition India and the world toward clean, renewable energy. Nationally, 58% of Indians think India should use less fossil fuels in the future, including majorities in all but 16 districts; a similar percentage think India should use more renewable energy (59%), but the spatial patterns differ slightly. Support for transitioning away from fossil fuels is lowest in Andhra Pradesh (37%) and highest in Haryana (70%), which suffers from severe air pollution. Support for using more renewable energy is highest in Goa and Kerala (72%) and lowest in Assam (41%).
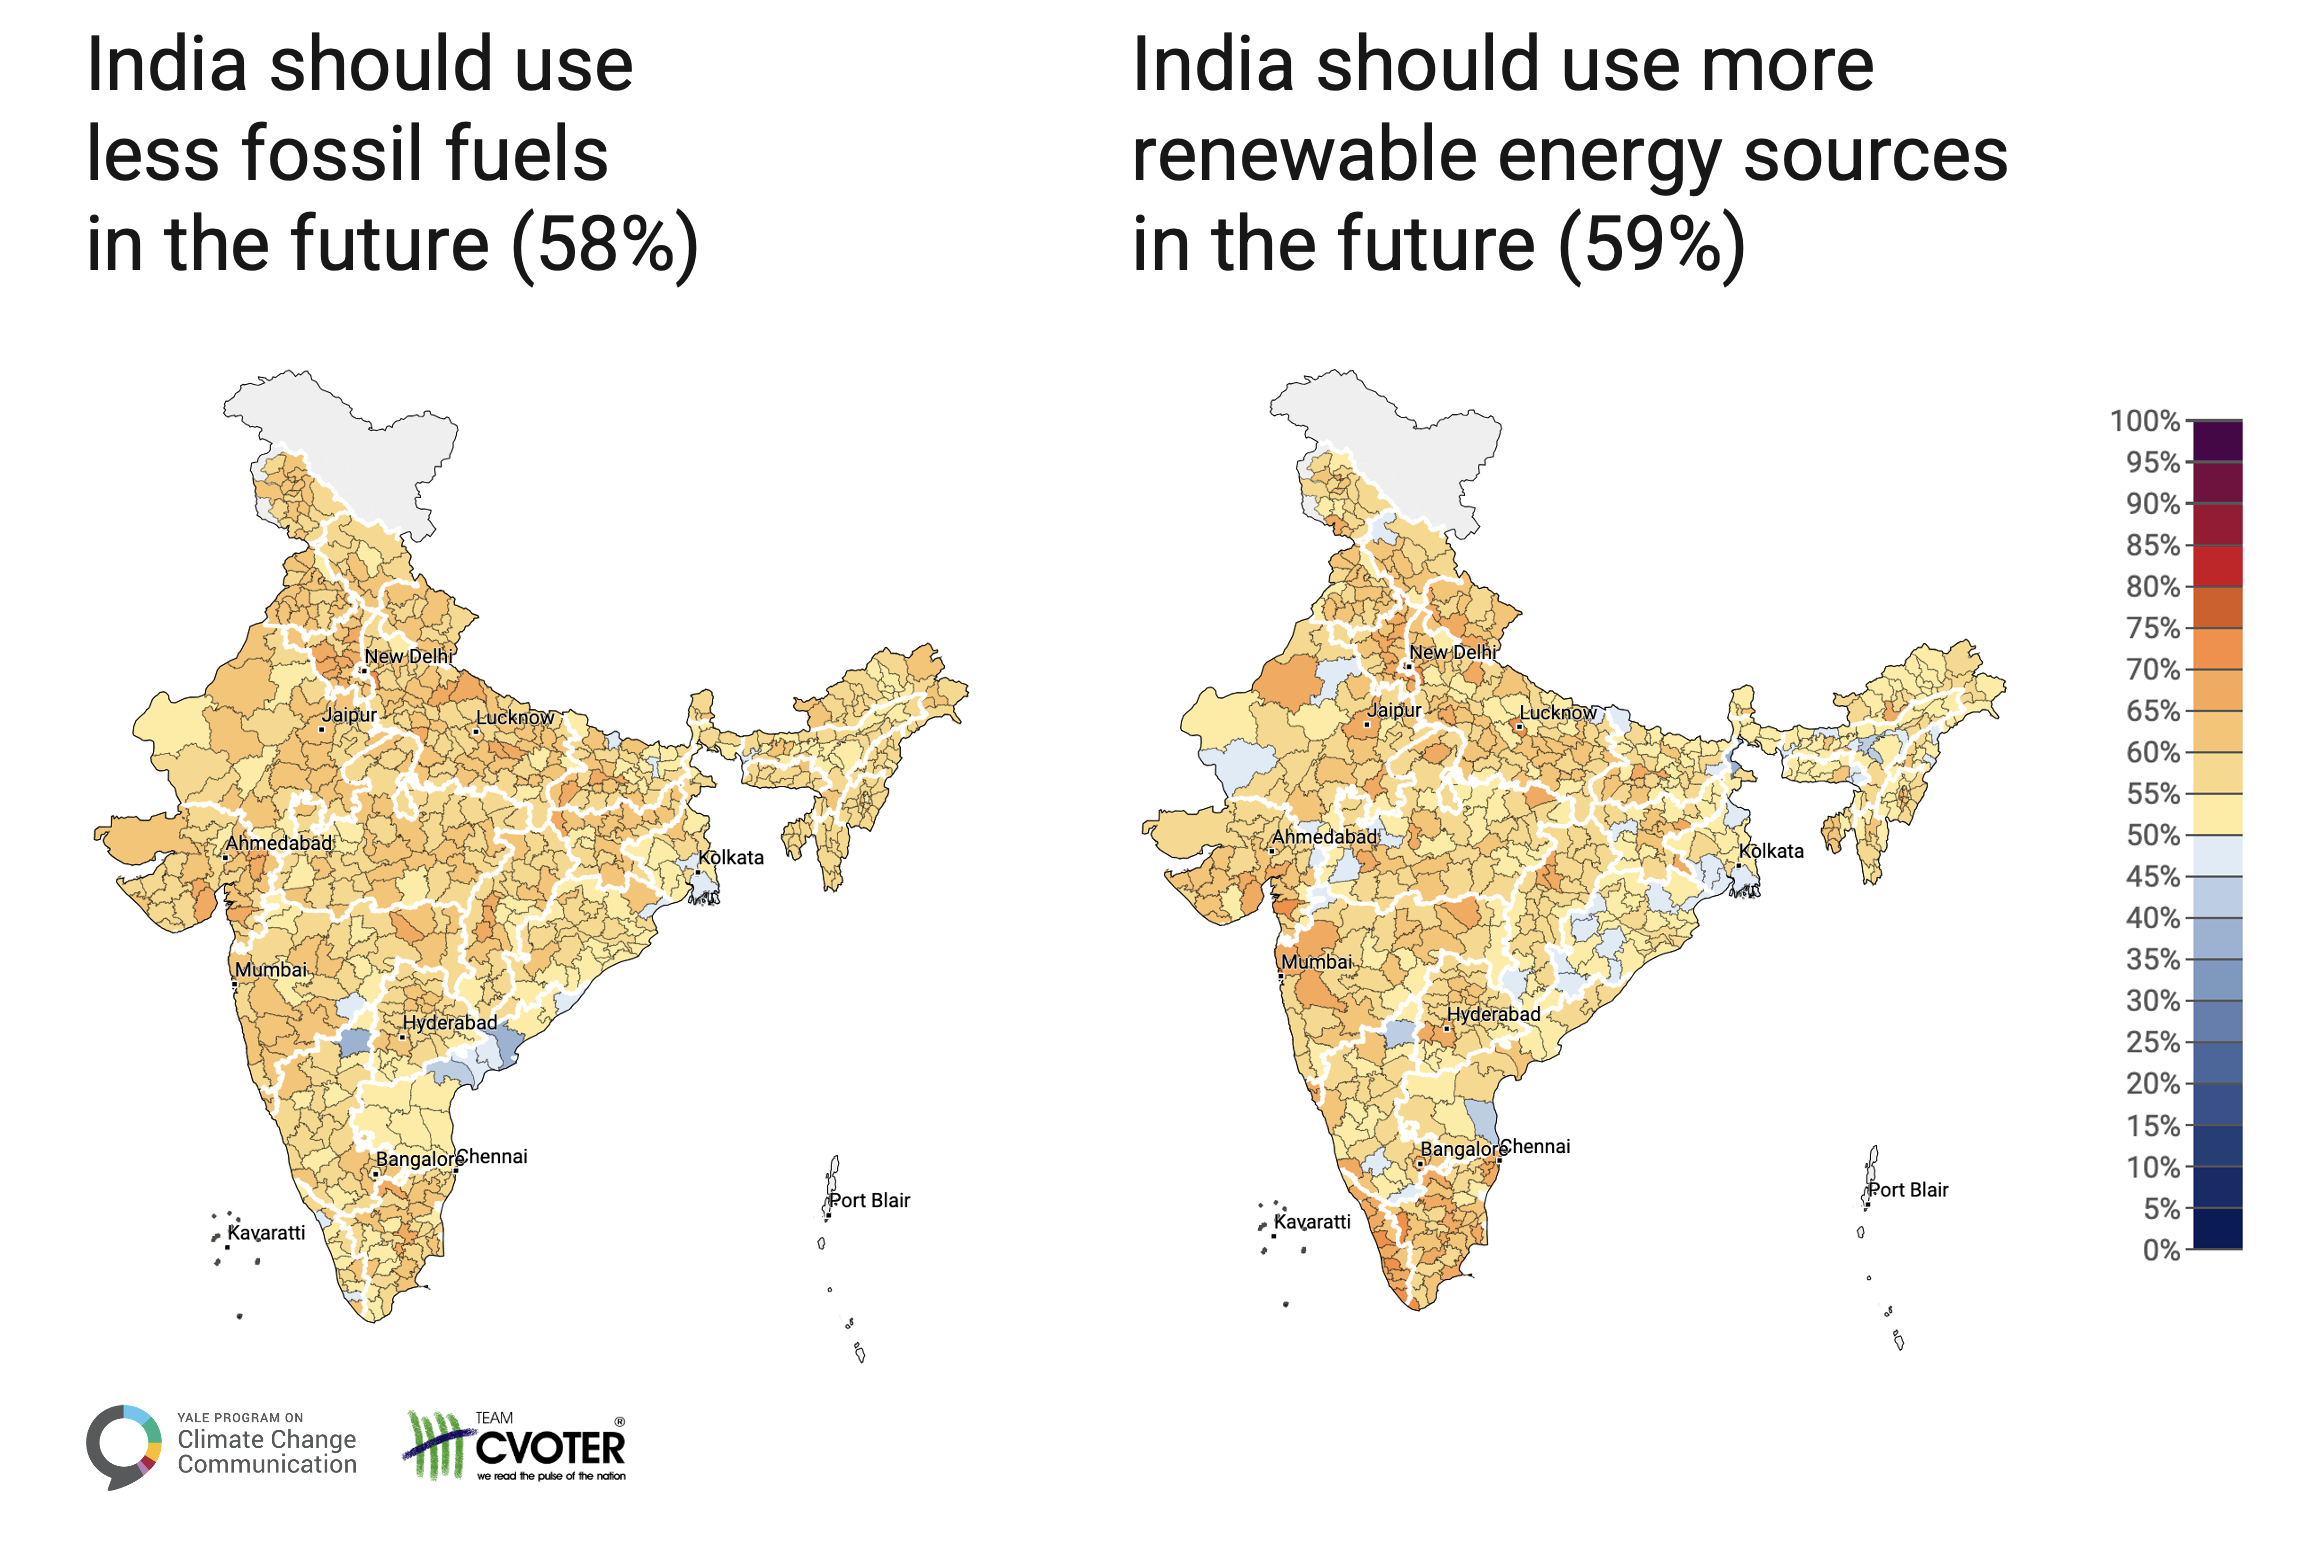
Figure 5. Spatial variations in global warming policy preferences across India. Nationally, 58% of people say India should use less fossil fuels in the future (left). About the same percentage (59%) say that India should use more renewable energy sources, but the spatial patterns of opinions on these two policies differ slightly from one another, with slightly stronger variation in opinions about renewable energy.
A better understanding of public climate change knowledge, beliefs, risk perceptions, and policy support can help decision-makers in India and beyond. As Indian states develop or update their respective State Action Plans on Climate Change and Net Zero targets, understanding and engaging the public will be critical to effective implementation of Indian climate solutions.
Methods
The modeling employs data from our two recent nationally representative surveys of Indian adults (18+) conducted October 2021 to January 2022 (n = 4,619) and September 2023 to November 2023 (n = 2,178), with a combined n of 6,797. The surveys were implemented by CVoter and were translated into 12 different languages. Respondents came from 34 of India’s 36 states and Union territories and from 539 of 604 modeled districts. No respondents came from the Lakshadweep or Andaman and Nicobar Islands, so estimates are not provided for these Union territories on the maps. Sample weights for all respondents were calculated by CVoter to be nationally representative and to reflect the large diversity of the Indian population across gender, language, education, caste, age, and income dimensions.
To allow modeling, individuals from the survey were matched with both their 2011 administrative states and districts and their current states and districts. Many new districts (and one state) have been created since 2011 and a few districts have merged. In most cases, whether areas were carved out of others or combined, the outer boundaries tended to remain stable. As a result, we successfully matched all but eleven new districts to the census counts for analogous districts from 2011. Districts identified in the new Indian government map that had changes to their borders and could not be matched to other data sources were assigned to one of the overlapping districts from the 2011 Indian census based on maps and information from government websites. Seven districts in the survey data could not be matched to any other data source and respondents assigned to those districts were assigned to overlapping modern and census districts using the same method.
Multilevel modeling with poststratification (MrP) was used to estimate the spatial distribution of India’s climate opinions at state and district levels (Howe et al. 2015; Mildenberger et al. 2016; 2017). Dependent variables were first recoded into binary format, with positive response values grouped and coded as “1” (e.g., “Somewhat favor” and “Strongly favor”) and non-positive values coded as “0” (“Somewhat oppose”, “Strongly oppose”, “Don’t know”, Refused); see “Survey Question Wording” on the interactive map tool tab for a full list of questions and how each was recoded to binary). MrP modeling then proceeded in two phases. First, the multi-level model is constructed by predicting individual survey responses as a function of both individual-level demographics (gender, age, caste, and urbanicity, as well as a four-way interaction term among these variables) and geography-level covariates (i.e., education and climate vulnerability). Second, “post-stratification”, or spatial weighting, is performed using the fitted model, where population-weighted opinion estimates for each demographic-geographic subtypes is aggregated based on the subtype population distribution within each geographic subunit. Climate vulnerability data for each state and district were obtained from the report Mapping India’s Climate Vulnerability (Mohanty and Wadhawan, 2021) and education data came from the Government of India for each 2011 state and district. The model configuration was selected after testing model fit using a variety of potential sociodemographic, environmental, and contextual predictors (e.g., climate vulnerability rating, percent of population with a secondary education or higher, total fertility rate, primary language, PM2.5, and percent tree cover) and interaction terms.
In an effort to support analysis of Indian climate policy and Indian climate risks, these new opinion data are made freely available to researchers and members of the public at https://climatecommunication.yale.edu/visualizations-data/ycomindia/. Additional model results and methodological details will be available in a forthcoming publication.