Climate Note · Feb 26, 2026
Exploring climate preparedness in low- and middle-income countries
By Jenny Liu, Jennifer Carman, Marija Verner, Emily Goddard, Jennifer Marlon, Seth Rosenthal and Anthony Leiserowitz
Filed under: Beliefs & Attitudes and Climate Impacts
The impacts of climate change are already happening, and will likely get worse. Thus, climate preparedness — the ability of governments, communities, and individuals to anticipate and increase resilience to climate impacts — will be key to protecting people from harm. This is particularly true in low- and middle-income nations in parts of Europe and the Global South. Because of their geographic locations and lower incomes, these countries often face greater harm from the impacts of climate change, despite being the least responsible for the carbon emissions that cause them.
In these regions, climate preparedness has emerged as a key issue. The more prepared and resilient a country or community is, the less likely it is to experience lasting harm when climate impacts strike. Preparedness can take many forms, including implementing national policies such as emergency alert systems and disaster relief funds, building and maintaining physical infrastructure such as flood levees, fostering community support networks, and encouraging individual capacity.
In this analysis, we explore the relationship between institutional climate change preparedness (i.e., economic, government, and social preparedness) and individuals’ perceptions of their own preparedness across 68 low- and middle-income countries and territories in Southeastern Europe and the Global South. Specifically, we examine the relationship between indicators of a country’s preparedness from the University of Notre Dame Global Adaptation Initiative’s ND-GAIN Readiness Score and individuals’ self-reported preparedness for extreme weather events from our international survey conducted in partnership with Meta and with Rare’s Center for Behavior and the Environment.
ND-GAIN assigns Readiness scores to 192 countries worldwide each year on 0-1 scale, with higher scores indicating greater levels of institutional preparedness.See the Methods for more details on how ND-GAIN calculated these scores. Countries are also ranked by their ND-GAIN score, with 1 being the highest ranking (highest Readiness score) and 192 being the lowest ranking (lowest Readiness score).
Our international survey asked, “How prepared are you and anyone else in your household for any extreme weather events you might experience?” We report the percentage of people in each country who say they are “very prepared” or “somewhat prepared” for extreme weather.
Individual Preparedness and Institutional Readiness by Country
Of the 68 countries and territories surveyed, there were only 13 where majorities said they are prepared for extreme weather. The country with the largest percentage of individuals who said they are prepared is Vietnam (70%), while the country with the smallest percentage of individuals who said they are prepared is Azerbaijan (17%). Of the countries included in this analysis, Qatar had the highest ND-GAIN Readiness score (0.55) and was ranked 40th out of the 192 countries, while the Democratic Republic of the Congo had the lowest score (0.21) and was ranked 189th.
We also compared the country-level relationship between the ND-GAIN Readiness Score and public perceptions of their own preparedness for extreme weather. The overall relationship between the two variables is very weak (R² < 0.01), suggesting that having a higher ND-GAIN Readiness score does not mean that people feel more prepared, or vice versa. Instead, the relationship between the proportion of countries’ self-reported preparedness and their respective ND-GAIN Readiness scores fell into four different quadrants.
In the figure below, the Readiness score is plotted on the horizontal axis, and the proportion of people who say they are “very” or “somewhat” prepared for extreme weather is plotted on the vertical axis. Country data points are sized based on population and colored by region: Asia (red), Caribbean (yellow), Central America (green), Europe (dark blue), North America (light blue), Southwest Asia & North Africa (light purple), Sub-Saharan Africa (purple). The horizontal and vertical dashed lines indicate the median value for each measurement, meaning that half of the sample is above/to the right of each dashed line, and half the sample is below/to the left of it (click the figure to enlarge).
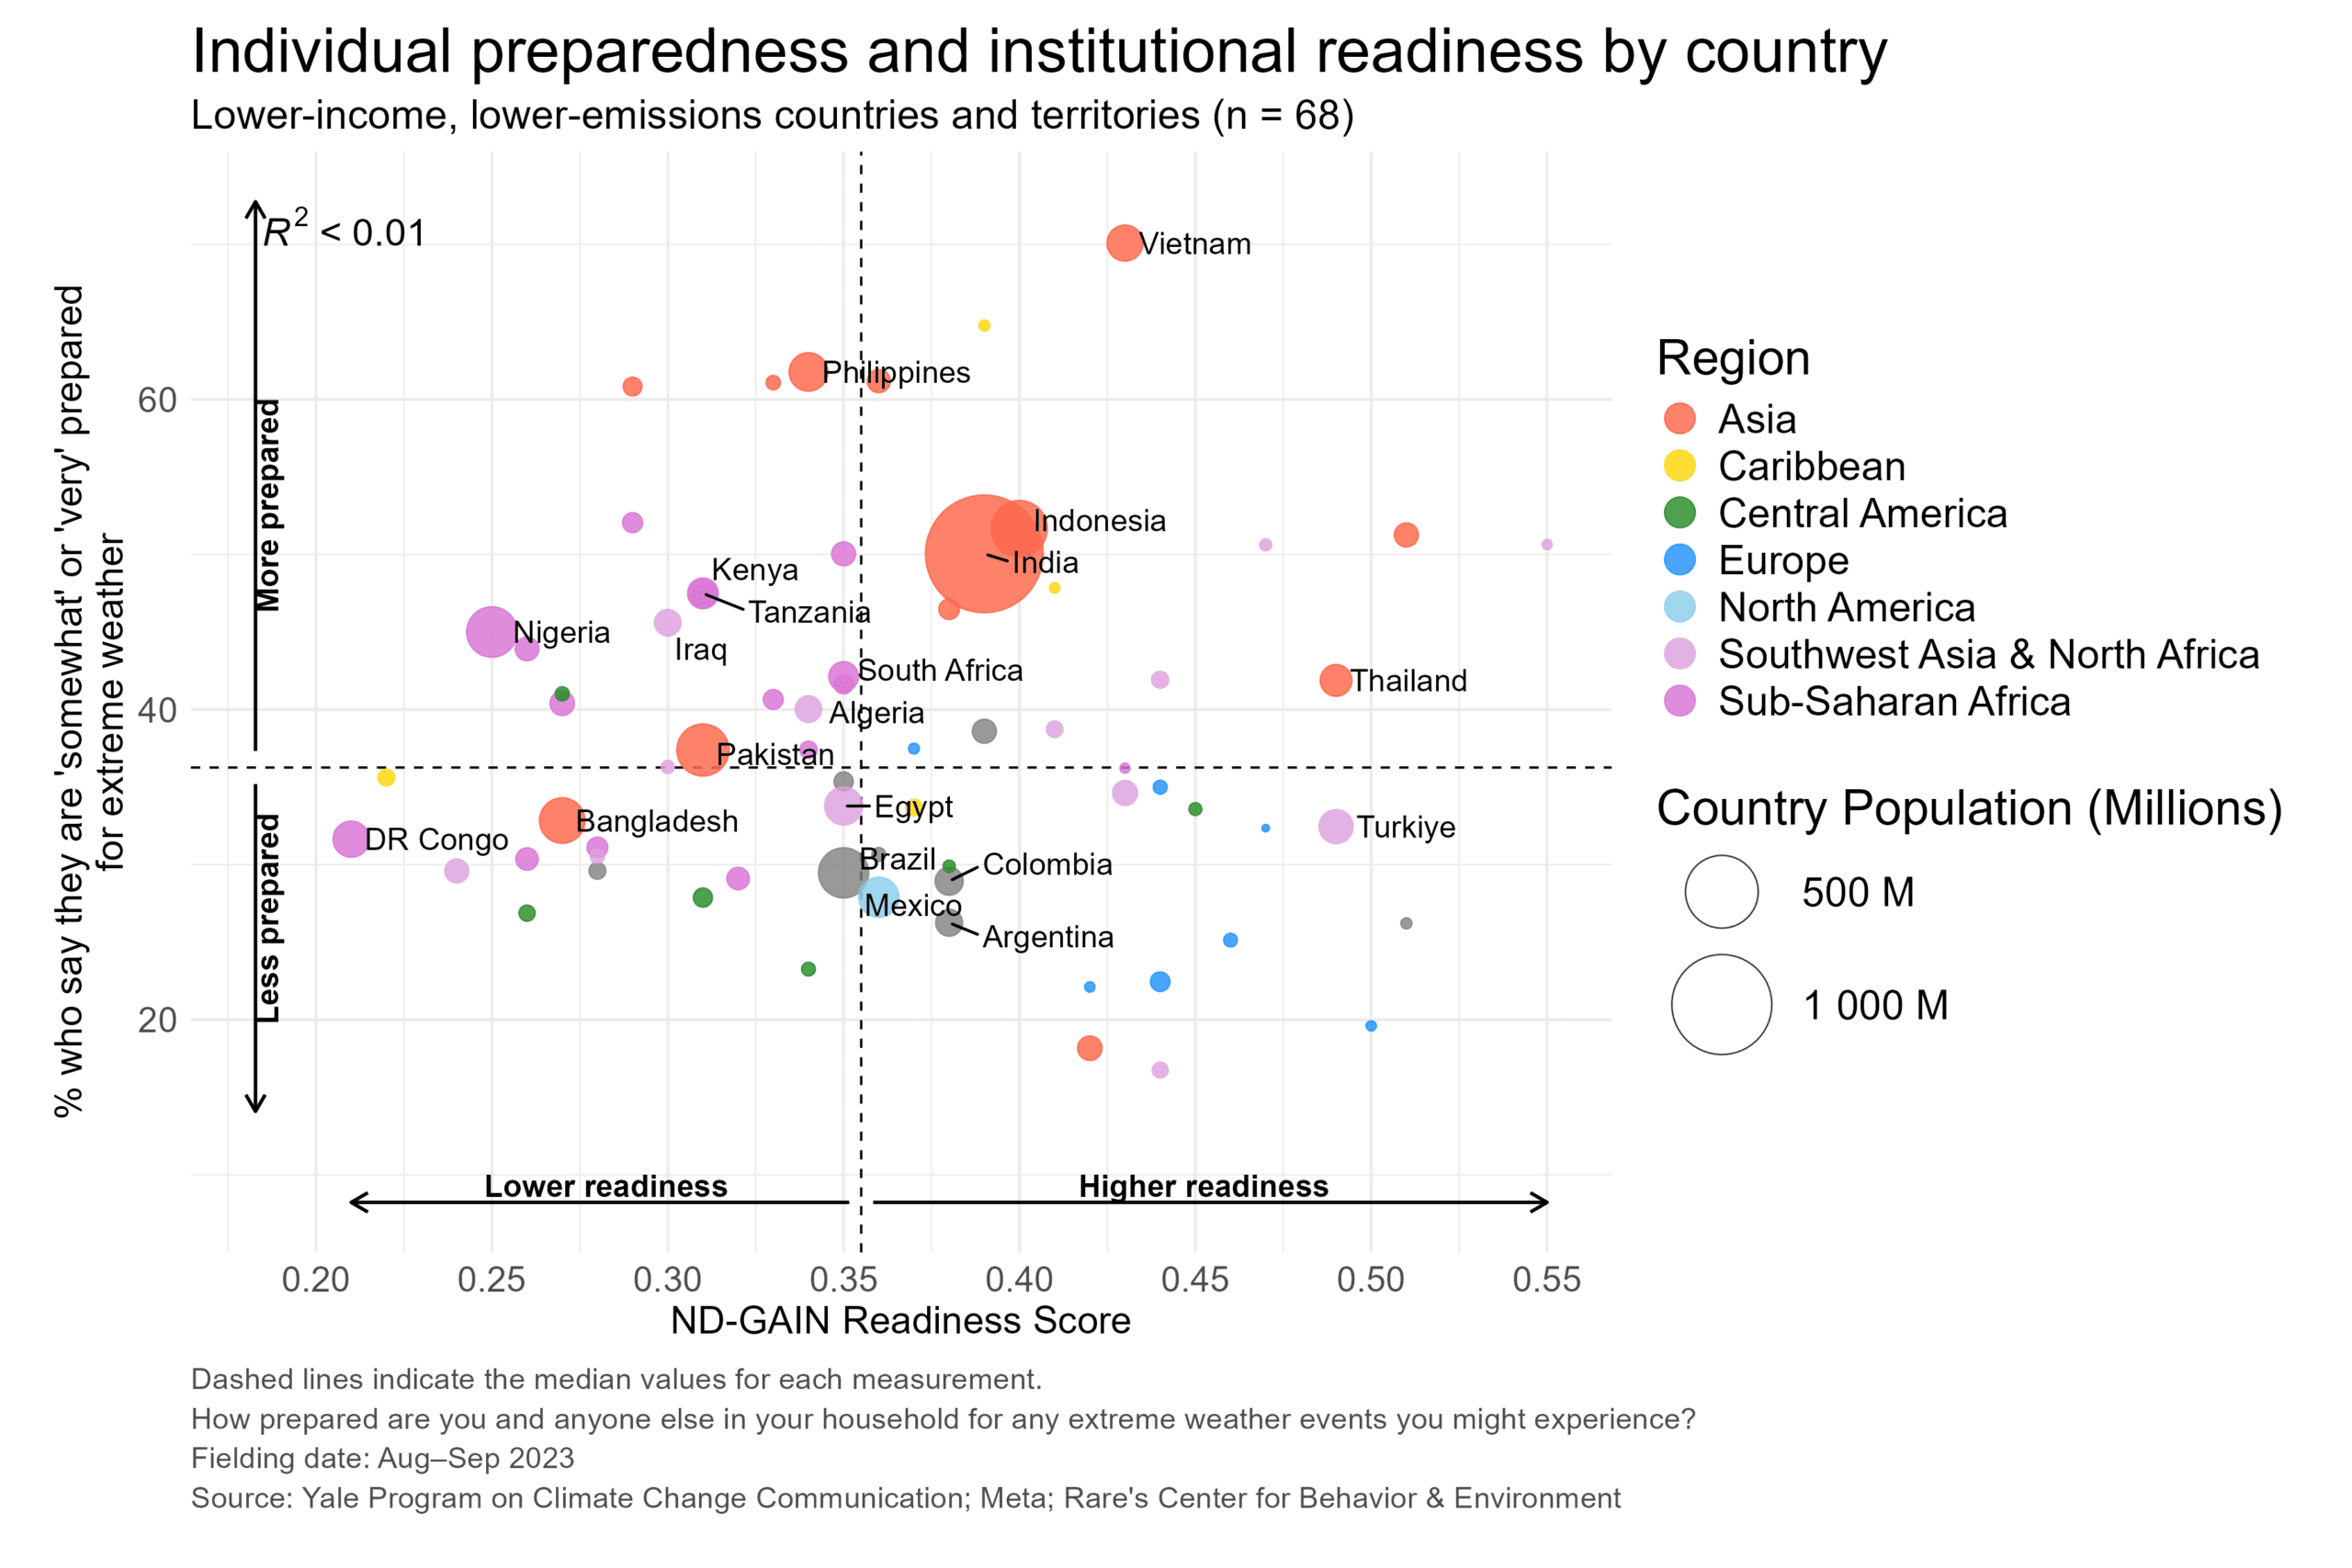
- The Lower Left quadrant indicates countries in the bottom half of the sample for both ND-GAIN Readiness scores (i.e., lower than the sample median score of 0.36) and personal preparedness (i.e., lower than the sample median percentage, 36%). This indicates both lower levels of institutional readiness and lower personal readiness, meaning that both individuals and governments may be less prepared for climate impacts. This quadrant includes countries experiencing war and conflict, such as Yemen (0.24 Readiness score, 30% prepared), as well as countries countries like the Democratic Republic of the Congo (0.21 Readiness score, 32% prepared), where a lack of weather measurement information hampers individuals’ ability to prepare for extreme events.
- The Lower Right quadrant indicates countries in the top half of the sample for ND-GAIN Readiness scores but in the bottom half for personal preparedness, indicating greater institutional readiness but lower personal readiness. This includes countries like Armenia (0.50 Readiness score, 20% prepared), which has developed a national climate change adaptation plan but nonetheless has low self-reported readiness among its residents.
- The Upper Left quadrant indicates countries that are in the bottom half of the sample for ND-GAIN Readiness scores but in the top half for personal preparedness, indicating lower institutional readiness but greater personal readiness. This includes countries like the Philippines (0.34 Readiness score, 62% prepared), where many individuals are taking action to prepare for extreme weather events.
- The Upper Right quadrant indicates countries in the top half of the sample for both ND-GAIN Readiness scores and personal preparedness, indicating greater levels of both institutional and personal readiness. This includes countries like Vietnam (0.43 Readiness score, 70% prepared), where organizations like the United Nations work with governments and communities to build preparedness for extreme weather events.
The countries in each quadrant are also illustrated in the map below (click to enlarge).

Key Takeaways
Together, these findings reveal that institutional readiness is not associated with perceived individual preparedness — or vice versa. These results suggest that people without institutional support may either be compensating for it, or overestimating their ability to adapt. This underscores the importance of synergizing government and individual climate resilience and adaptation planning.
As a result, climate resilience requires tailored strategies. For instance, countries with relatively high ND-GAIN Readiness scores but low self-reported preparedness may have greater institutional infrastructure and capacity to adapt than other countries, but still need programs that increase public climate change risk perceptions and adaptation behaviors. In contrast, countries with low ND-GAIN Readiness scores but higher survey scores may have relatively stronger grassroots awareness and coping strategies but weaker governance and investment to promote long-term adaptation. Countries that consistently have low ND-GAIN Readiness scores and low personal preparedness, such as those in Sub-Saharan Africa and Southwest Asia & North Africa, may need a combination of both institutional and individual capacity-building.
One example of such a combination is in the Gaibandha district in northern Bangladesh. Because of its low-lying geography, Gaibandha is extremely vulnerable to flooding. As a result, the district is often covered by water during the monsoon season. This makes it extremely difficult to grow crops using traditional methods. The international NGO Practical Action is working with local communities to develop ways that farmers can grow food on flooded land. This involves a process of community-led identification and prioritization of natural resource management options. Villagers in Gaibandha are now experimenting with using floating gardens to grow vegetables such as bitter gourds, green okra, and leafy greens. Practical Action has also helped over 40,000 individuals across eight communities get reliable access to flood warning risks, be it through voice messages, digital weatherboards, or local resilience agents. Recognizing these distinct needs within and among countries is key for international organizations, philanthropies, and policymakers designing adaptation programs.
Moreover, most of the countries examined here (48 out of 68) are in the bottom half of ND-GAIN’s Readiness score rankings. This indicates significant vulnerability in these areas and underscores the urgent need for investment, capacity-building, and international support in low- and moderate-income countries.
This is all the more significant in light of the United States’ funding cuts to the U.S. Agency for International Development (USAID). This aid previously supported activities across the mitigation and adaptation spectrum. Countries and communities who previously benefited from these funds may struggle to continue their adaptation work. As one example, several terminated programs in Nepal were working to increase agricultural diversity and productivity. This was in addition to strengthening the capacity of Nepal’s national agricultural research institutions. Without these programs, communities are at greater risk of crop failures, instability, and displacement as climate impacts worsen. Closing these gaps will require not just local action, but significant global collaboration and financing to improve climate resilience.
Methods
The questions were taken from an international survey conducted in partnership between the Yale Program on Climate Change Communication (YPCCC), Meta, and Rare’s Center for Behavior & the Environment from August 3 – September 3, 2023. The report describes self-reported public exposure to and preparedness for extreme weather disasters among 99,453 Facebook users in 68 countries that are classified as “low-emissions.” The countries in this list have both: (1) below global average per-capita emissions (4.4 tons CO2e) and (2) a GNI per-capita that is below the World Bank’s criterion for a classification of “high income” (i.e., less than $12,535 USD).
Institutional preparedness was estimated using the Readiness score component of the ND-GAIN Country Index, developed through the University of Notre Dame’s Global Adaptation Initiative. The ND-GAIN Readiness score takes into account three components: economic readiness, governance readiness, and social readiness. Economic readiness refers to the ability of a country’s economy to accept investment to reduce vulnerability; governance readiness refers to factors such as a government’s control of corruption and its ability to develop adaptation policy; and social readiness refers to whether a society has strong education systems and adequate communication and information technologies. Scores for each component are assigned on a 0-1 scale (with higher scores indicating greater levels of preparedness), and the three scores are averaged to create a single Readiness score.
Note that Puerto Rico does not have a separate ND-GAIN score as part of the main ND-GAIN Index, since Puerto Rico is a territory of the United States. We instead substituted the ND-GAIN U.S. Urban Adaptation Assessment Readiness score of 0.385986 from San Juan, the largest city in Puerto Rico, as a proxy value. We also substituted the population for Puerto Rico using the 2023 population (to align with the survey year) from the World Bank. All other population data is used from ND-GAIN.