Climate Note · Oct 8, 2024
YPCCC’s Resources on Climate in the 2024 U.S. General Election
By Anthony Leiserowitz, Edward Maibach, Jennifer Carman, Jennifer Marlon, John Kotcher, Seth Rosenthal and Joshua Low
Filed under: Policy & Politics

2024 is a critically important election year for the climate in the U.S. and around the world. As Election Day nears in the U.S., we are providing a final round-up of our election-relevant resources and insights. Many important climate policies, including the transition to clean energy, investments in underserved and more vulnerable communities, and participation in international climate treaties, will be determined by voters’ choices in the 2024 elections. In California, voters are voting on Proposition 4, which would fund flood protection and climate resiliency projects. In Washington state, voters are being asked to repeal the state’s cap-and-invest program and to preempt local governments from restricting access to methane gas.
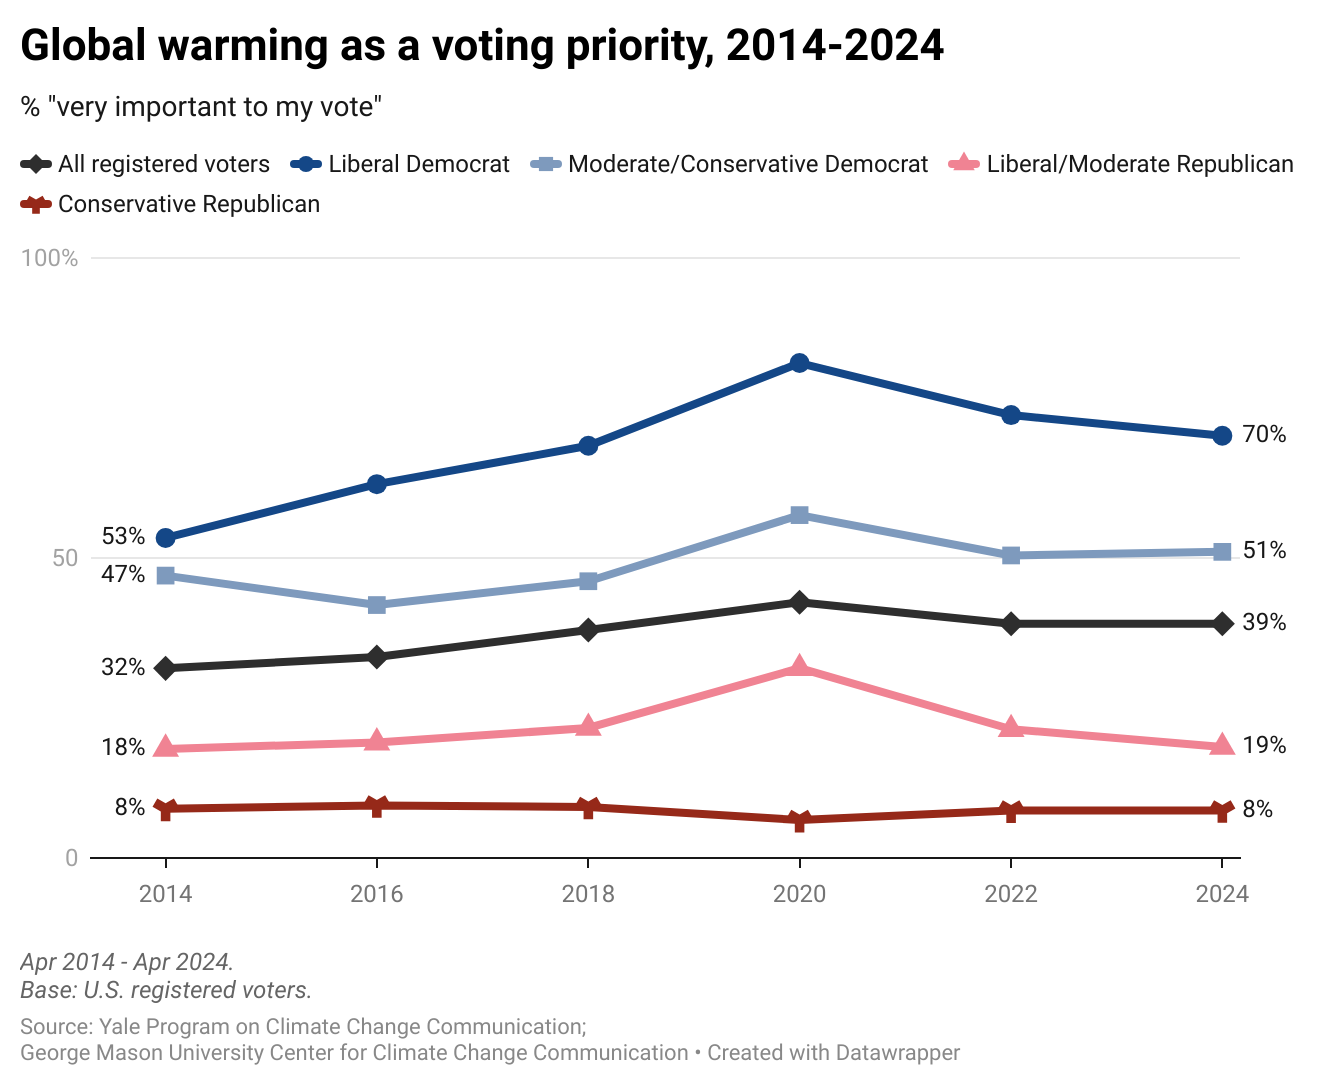
We, along with our partners at the George Mason University Center for Climate Change Communication, have tracked global warming as a voting priority in each presidential and midterm election since 2014. We find that in 2024, 39% of registered voters overall say that global warming is a “very important” issue for their vote, including 70% of liberal Democrats, 51% of moderate/conservative Democrats, 19% of liberal/moderate Republicans, and 8% of conservative Republicans. We find that the percentage of voters who think global warming is a “very important” issue has increased slightly over time, with 32% of registered voters saying so in 2014 and 39% saying so in 2024. Our subsequent analysis in 2024 found that virtually all of these voters prefer a pro-climate candidate.
Additional Resources from Our Research:
- Climate Change in the American Mind: Politics & Policy, Spring 2024: Our twice-yearly study of American public opinion on global warming (conducted in partnership with George Mason University) finds a majority of all U.S. voters (62%) prefer to vote for a candidate who supports action on global warming. Global warming is the #4 voting issue for liberal Democrats.
- Understanding pro-climate voters in the United States: 37% of U.S. registered voters are pro-climate voters — about 60 million people. Pro-climate voters are more likely to vote in the November 2024 presidential election than other voters. Still, millions of high-potential voters care about climate issues and are unlikely to vote unless civic engagement organizations register them and work to turn them out to vote.
- Changes in U.S. voters’ top reasons to reduce global warming: When asked to choose their most important reasons to reduce global warming, U.S. voters’ top choice is ”to provide a better life for our children and grandchildren.” This reason was also the top choice over time and across party/ideology groups. Since 2017, more U.S. voters say one of their top reasons to reduce global warming is to prevent extreme weather events.
- Yale Climate Opinion Maps and Factsheets: Our map tools show that Americans’ acceptance of global warming is widespread and majorities in nearly every state think weather is becoming more extreme as a result. Yet, there is little agreement about whether and how to address the source of the problem: carbon pollution. More data about a wide range of U.S. climate change beliefs, risk perceptions, and policy preferences are available through these tools for each state, county, and metro area, and most Congressional districts as of 2023.
YPCCC Partnership Resources:
- YPCCC Partnerships Interview with Interfaith Power & Light (IPL)’s Rev. Susan Hendershot and Tiffany Hartung: During the 2020 presidential election campaign, YPCCC worked with IPL on their nonpartisan civic engagement campaign to identify infrequent voters who are both people of faith and worried about climate change. IPL volunteers then contacted those voters via peer-to-peer texting with values- and faith-based messaging to encourage them to vote and to check their voter registration.
Stories from Yale Climate Connections:
- How to talk with (just about) anyone about climate and the 2024 elections
- ‘Basic peer pressure’: The plan to turn out millions of pro-climate voters in the 2024 U.S. election
- How Kamala Harris and Donald Trump compare on climate change
Methods
The results of the analysis included in the chart are based on data from 6 waves (April 2014, March 2016, March 2018, April 2020, April 2022, April 2024) of the twice-yearly Climate Change in the American Mind survey – a nationally representative survey of U.S. public opinion on climate change conducted by the Yale Program on Climate Change Communication and the George Mason University Center for Climate Change Communication. Data were collected using the Ipsos KnowledgePanel®, a representative online panel of U.S. adults ages 18 and older. Questionnaires were self-administered online in a web-based environment.
This analysis includes only registered voters. Data were weighted to align with demographic parameters in the United States. Among the subset of registered voters, references to Republicans and Democrats throughout include respondents who initially identify as either a Republican or Democrat, as well as those who do not initially identify as a Republican or Democrat but who say they “are closer to” one of those parties (i.e., “leaners”) in a follow-up question. The category “Independents” does not include any of these “leaners.” Independents and respondents who do not identify with a party or are not interested in politics are not included in this report due to small sample size.
Group differences were tested for statistical significance using the weighted proportions and unweighted sample sizes of each group. For tabulation purposes, percentage points are rounded to the nearest whole number. The fielding dates and average margins of error at the 95% confidence interval for the subset of registered voters who participated in the survey, as well as each subgroups are:
- April 2024 (April 25 – May 4, 2024)
- All U.S. registered voters +/- 3.3 percentage points (n = 896)
- Liberal Democrat +/- 6.4 percentage points (n = 234)
- Moderate/conservative Democrat +/- 7.1 percentage points (n = 188)
- Liberal/moderate Republican +/- 9.4 percentage points (n = 109)
- Conservative Republican +/- 6.6 percentage points (n = 221)
- April 2022 (April 13 – May 2, 2022)
- All U.S. registered voters +/- 3.2 percentage points (n = 908)
- Liberal Democrat +/- 6.9 percentage points (n = 201)
- Moderate/conservative Democrat +/- 7.3 percentage points (n = 178)
- Liberal/moderate Republican +/- 9.1 percentage points (n = 116)
- Conservative Republican +/- 6.0 percentage points (n = 266)
- April 2020 (April 7 – 17, 2020)
- All U.S. registered voters +/- 3.2 percentage points (n = 911)
- Liberal Democrat +/- 6.8 percentage points (n = 208)
- Moderate/conservative Democrat +/- 7.2 percentage points (n = 183)
- Liberal/moderate Republican +/- 8.1 percentage points (n = 145)
- Conservative Republican +/- 6.0 percentage points (n = 264)
- March 2018 (March 7 – 24, 2018)
- All U.S. registered voters +/- 3.0 percentage points (n = 1,067)
- Liberal Democrat +/- 6.0 percentage points (n = 265)
- Moderate/conservative Democrat +/- 6.9 percentage points (n = 204)
- Liberal/moderate Republican +/- 8.0 percentage points (n = 149)
- Conservative Republican +/- 5.9 percentage points (n = 276)
- March 2016 (March 18 – 31, 2016)
- All U.S. registered voters +/- 3.1 percentage points (n = 1,004)
- Liberal Democrat +/- 6.2 percentage points (n = 249)
- Moderate/conservative Democrat +/- 6.9 percentage points (n = 200)
- Liberal/moderate Republican +/- 8.5 percentage points (n = 132)
- Conservative Republican +/- 6.0 percentage points (n = 267)
- April 2014 (April 15 – 22, 2014)
- All U.S. registered voters +/- 2.9 percentage points (n = 1,176)
- Liberal Democrat +/- 6.9 percentage points (n = 202)
- Moderate/conservative Democrat +/- 6.8 percentage points (n = 207)
- Liberal/moderate Republican +/- 7.2 percentage points (n = 187)
- Conservative Republican +/- 4.9 percentage points (n = 404)
Complete question wording by year:
- How important will the following issues be when you decide who you will vote for in the 2014 Congressional election? [Global warming]
- How important will the following issues be when you decide who you will vote for in the 2016 Presidential election? [Global warming]
- How important will the candidates’ positions on the following issues be when you decide who you will vote for in the 2018 Congressional election? [Global warming]
- As of today, how important will the following issues be to you when you decide who you will vote for in the 2020 Presidential election? [Global warming]
- As of today, how important will the following issues be to you when you decide who you will vote for in the 2022 Congressional elections? [Global warming]
- As of today, how important will the following issues be to you when you decide who you will vote for in the 2024 Presidential election? [Global warming]
View Data Tables for accessibility