Climate Note · Aug 16, 2022
More Educational Outreach on Extreme Heat Needed in the Midwest and Southwest
By Raffaele Sindoni Saposhnik, Liz Neyens, Spencer Blackwood, Jennifer Carman and Jennifer Marlon
Filed under: Audiences and Climate Impacts

This new research points to a need for more educational outreach on extreme heat, especially in the midwest and southwest.
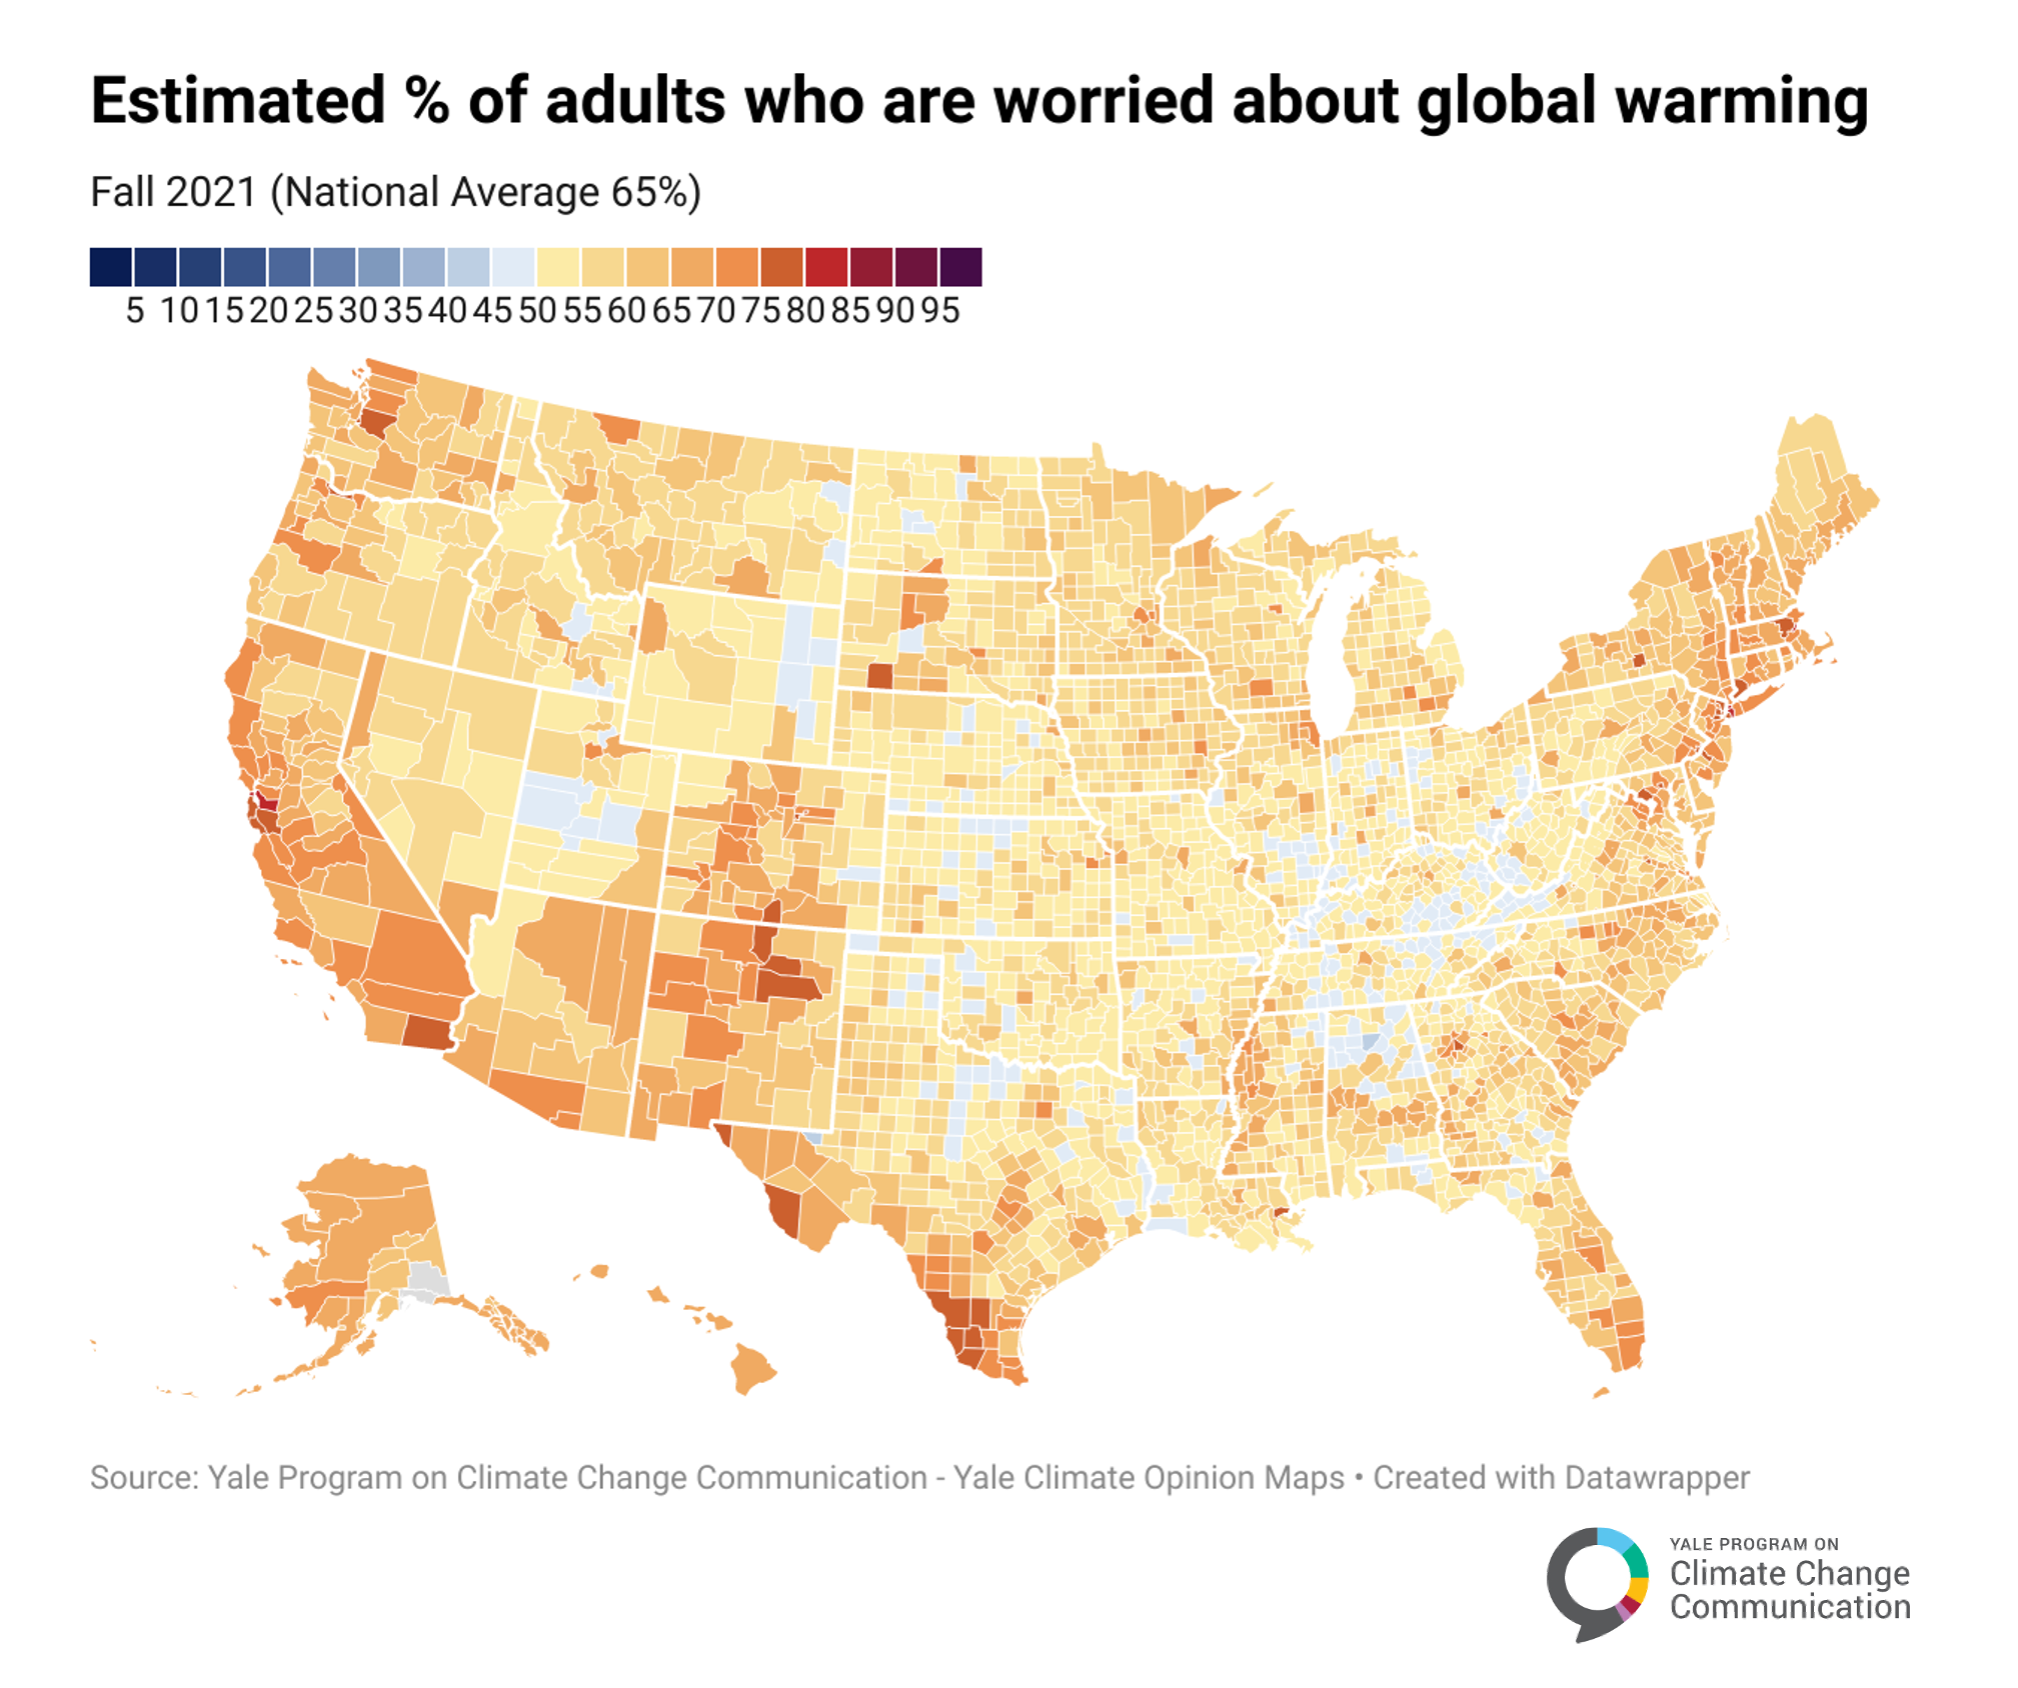
Due to global warming, people around the world are experiencing a greater number of extreme heat events. More than 150 million people in the United States experienced heat warnings or heat advisories in July 2022, with some areas experiencing record-breaking temperatures or record-breaking stretches of consecutive days over 100°F (38°C). The heat is not only uncomfortable, it’s deadly for some, especially for older adults, those on certain medications, pregnant women, children, and many others. Yet, public opinion estimates from the Yale Climate Opinion Maps show that 65% of Americans were “very” or “somewhat” worried about global warming in the fall of 2021, with substantial county-level variation. Nationally, only 47% of Americans think they will be personally harmed by global warming.
Exposure to weather-related hazards also varies across the United States, so to better understand the relationship between exposure to extreme heat and worry about global warming, we analyzed historical county-level data from the U.S. Federal Emergency Management Agency (FEMA) alongside our survey data.
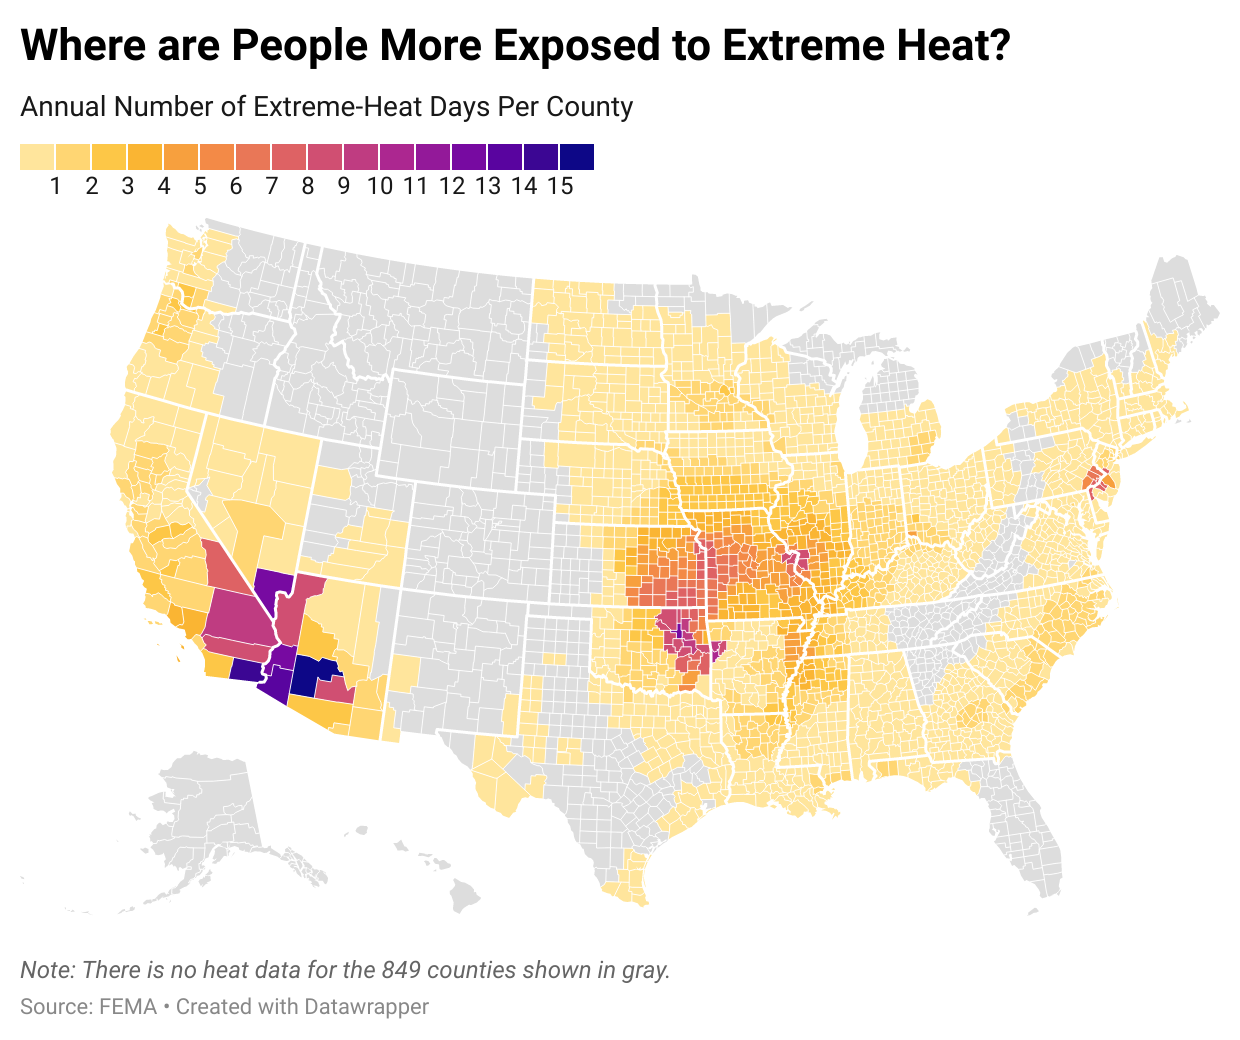
FEMA’s heat data provide the average number of extreme heat days per year in each county over the last 12 years. Extreme heat days, in this case, are based on locally defined temperature classifications by National Weather Service (NWS) forecast offices. These locally defined classifications of “extreme heat” provide more context than extreme heat indices that rely on a single threshold (e.g., days above 95 degrees) for the whole country. FEMA’s data on extreme heat days is incomplete, but covers about 80% of the total U.S. population. The existing data show “hot spots” of extreme heat exposure in the southwestern United States, the south-central Midwest, and the mid-Atlantic region.
Many areas that already experience severe heat waves will see lengthened heat wave duration and higher temperatures as the effects of global warming deepen.
To what extent does past exposure to extreme heat correlate with worry about global warming?
We compared the historical FEMA extreme heat data with county-level estimates of public worry about global warming. In the figure below, past extreme heat exposure from FEMA is plotted on the horizontal axis (using a log scale) and the estimated percentage of county residents who are “very” or “somewhat” worried about global warming is plotted on the vertical axis. County data points are sized according to population and colored by region: Midwest (pink), Northeast (yellow), South (green), and West (blue).
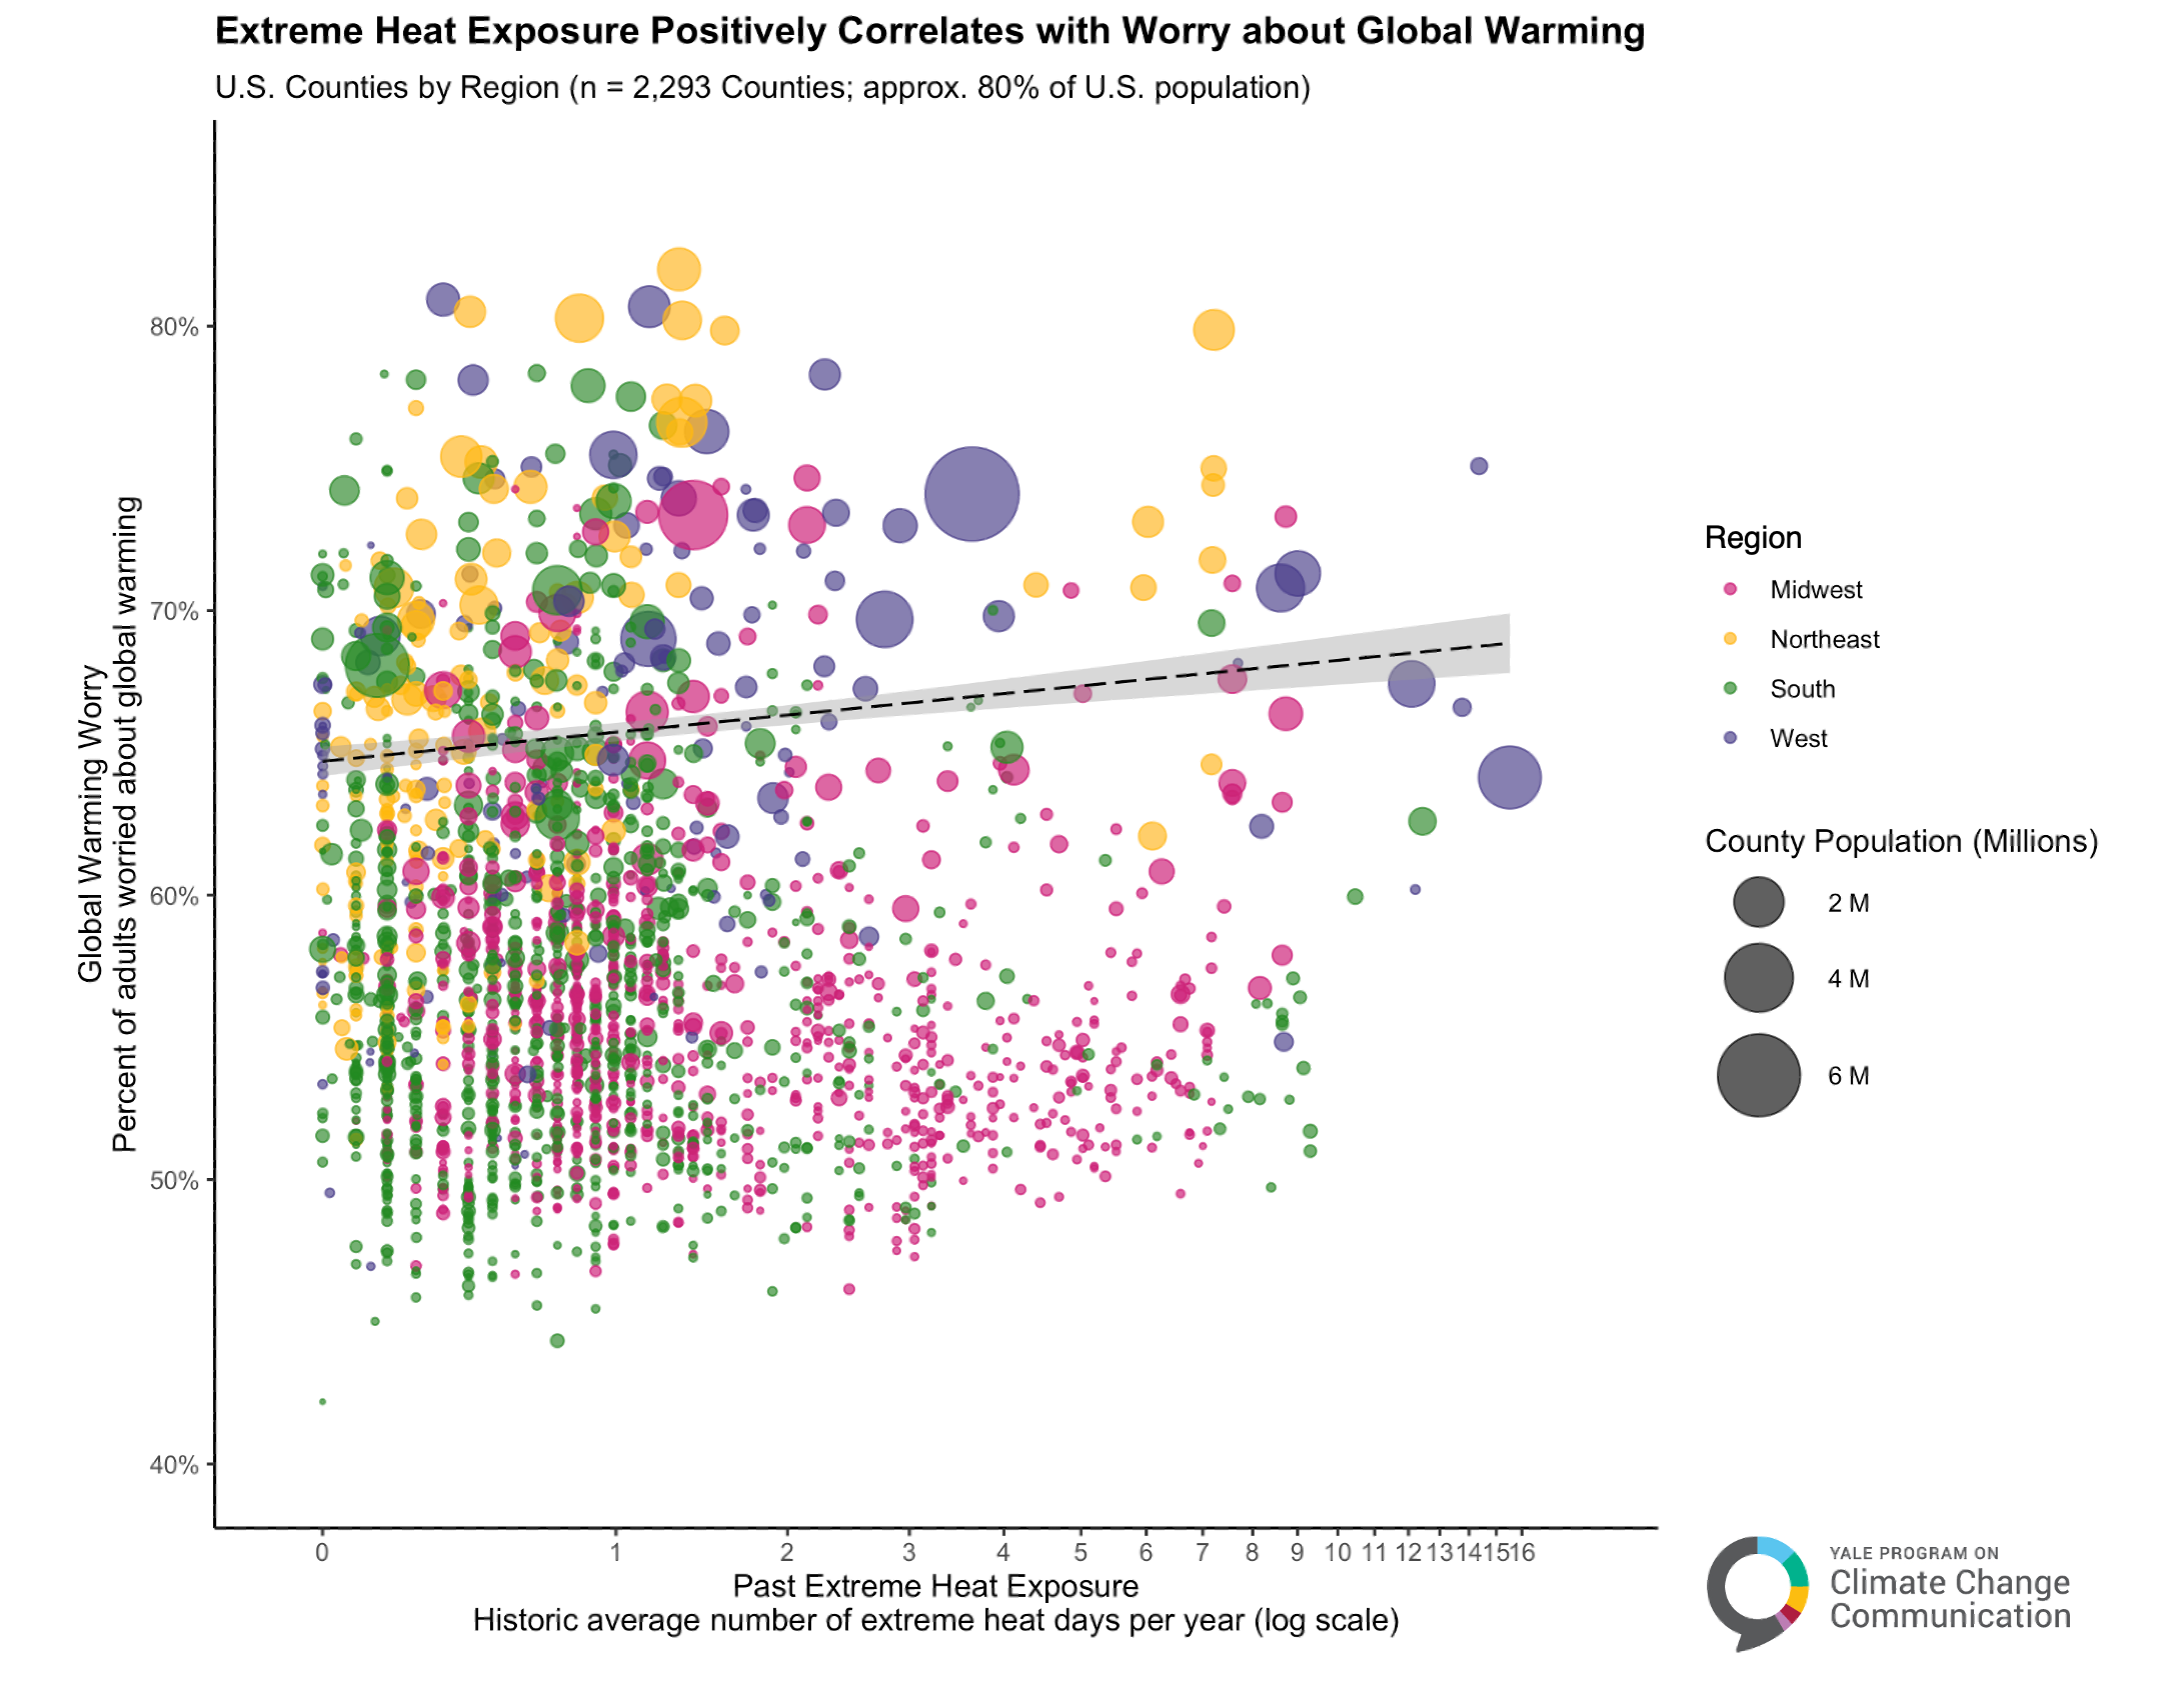
When calculating a population-weighted correlation coefficient, we observe a positive correlation (r = 0.12) between past exposure to extreme heat and worry about global warming across the 2,293 counties in the FEMA dataset. This relationship suggests that living in areas that experience more days of extreme heat is associated with higher levels of worry about global warming.
We then divided the scatter plot above into four quadrants, shown below, where the quadrants are defined by the average level of exposure to extreme heat and the average level of worry among the available counties. Counties with (1) lower exposure to extreme heat and higher worry about global warming are located in the top left quadrant; (2) lower exposure and lower worry counties in the bottom left; (3) higher exposure and higher worry in the top right; and (4) higher exposure but lower worry in the bottom right.
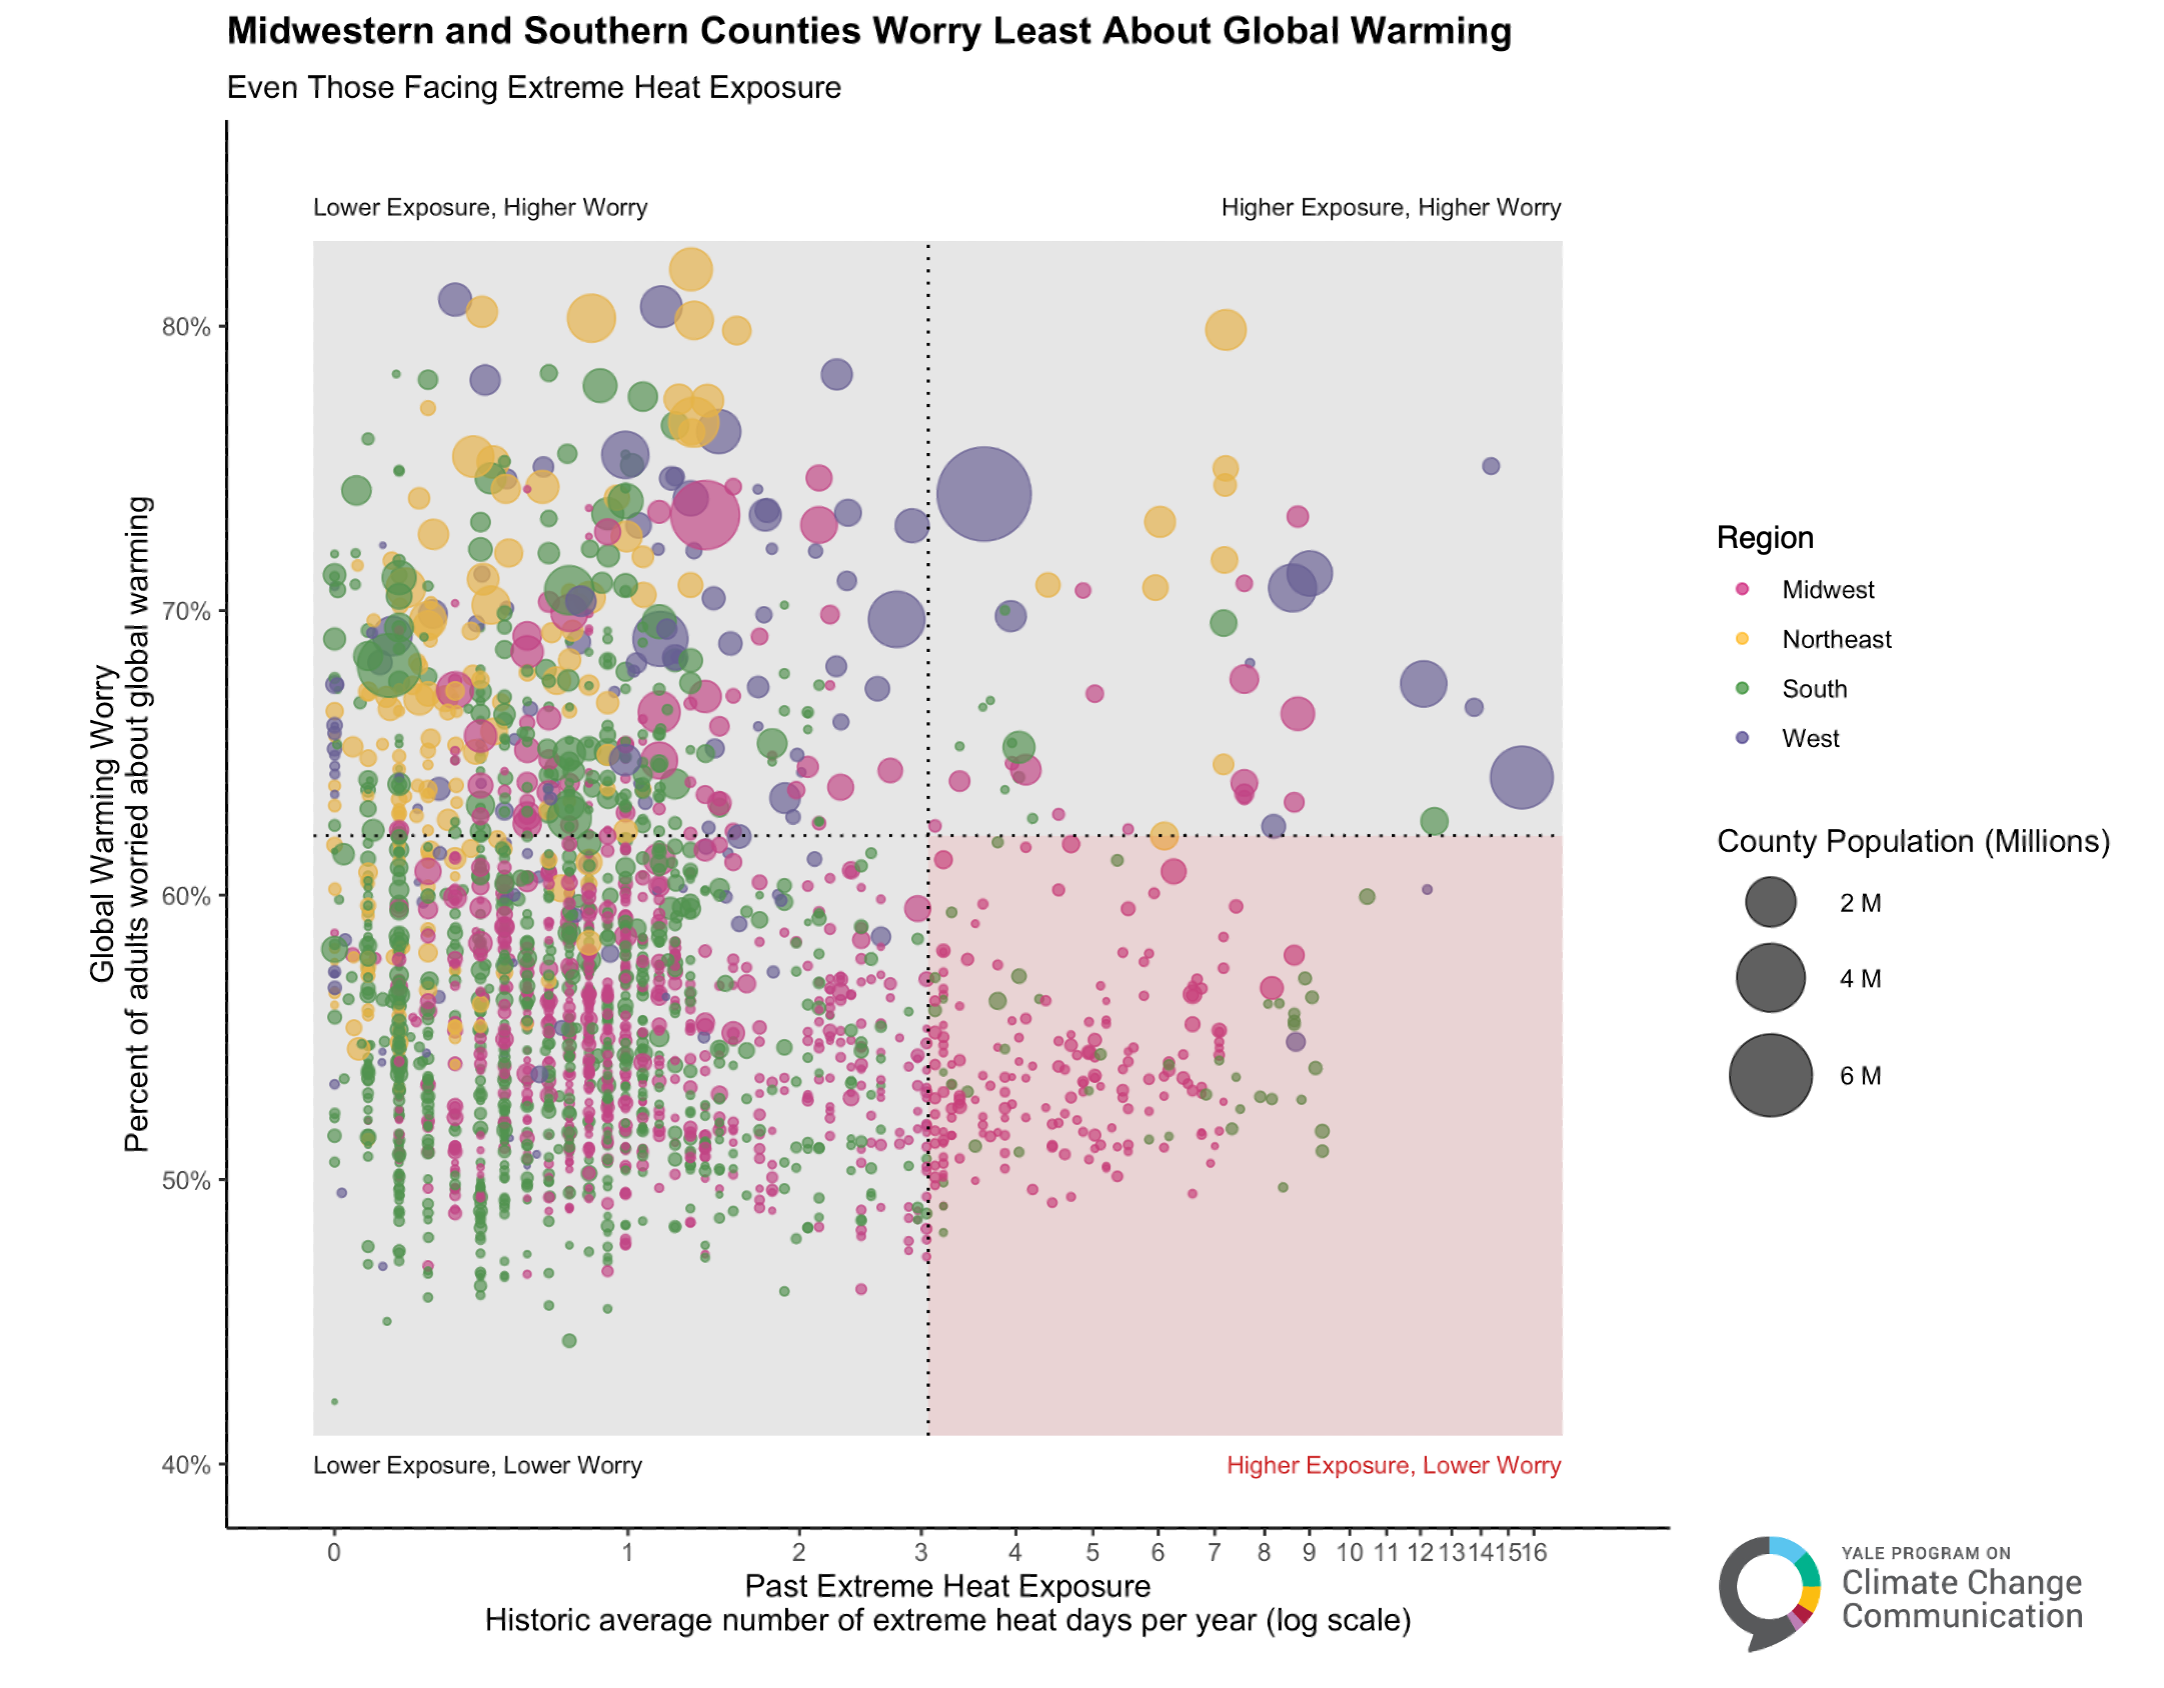
Despite the overall positive correlation between past exposure to extreme heat and worry about global warming, geography appears to be an important factor affecting this relationship.
Counties in the West (blue bubbles), which have some of the largest populations among counties with existing heat data (but also higher rates of missing data), tend to face higher exposure to extreme heat and also have higher levels of worry about global warming. Many counties in the Northeast (yellow) show higher levels of worry about global warming despite lower-than-average (historical) exposure to extreme heat. Counties in the South (green) tend to have lower-than-average exposure to extreme heat and vary in their perceptions of global warming.
Of greatest concern are the counties in the lower right-hand quadrant of the scatter plot. These counties are primarily in the Midwest and have relatively high exposure to extreme heat but lower-than-average levels of worry about global warming.
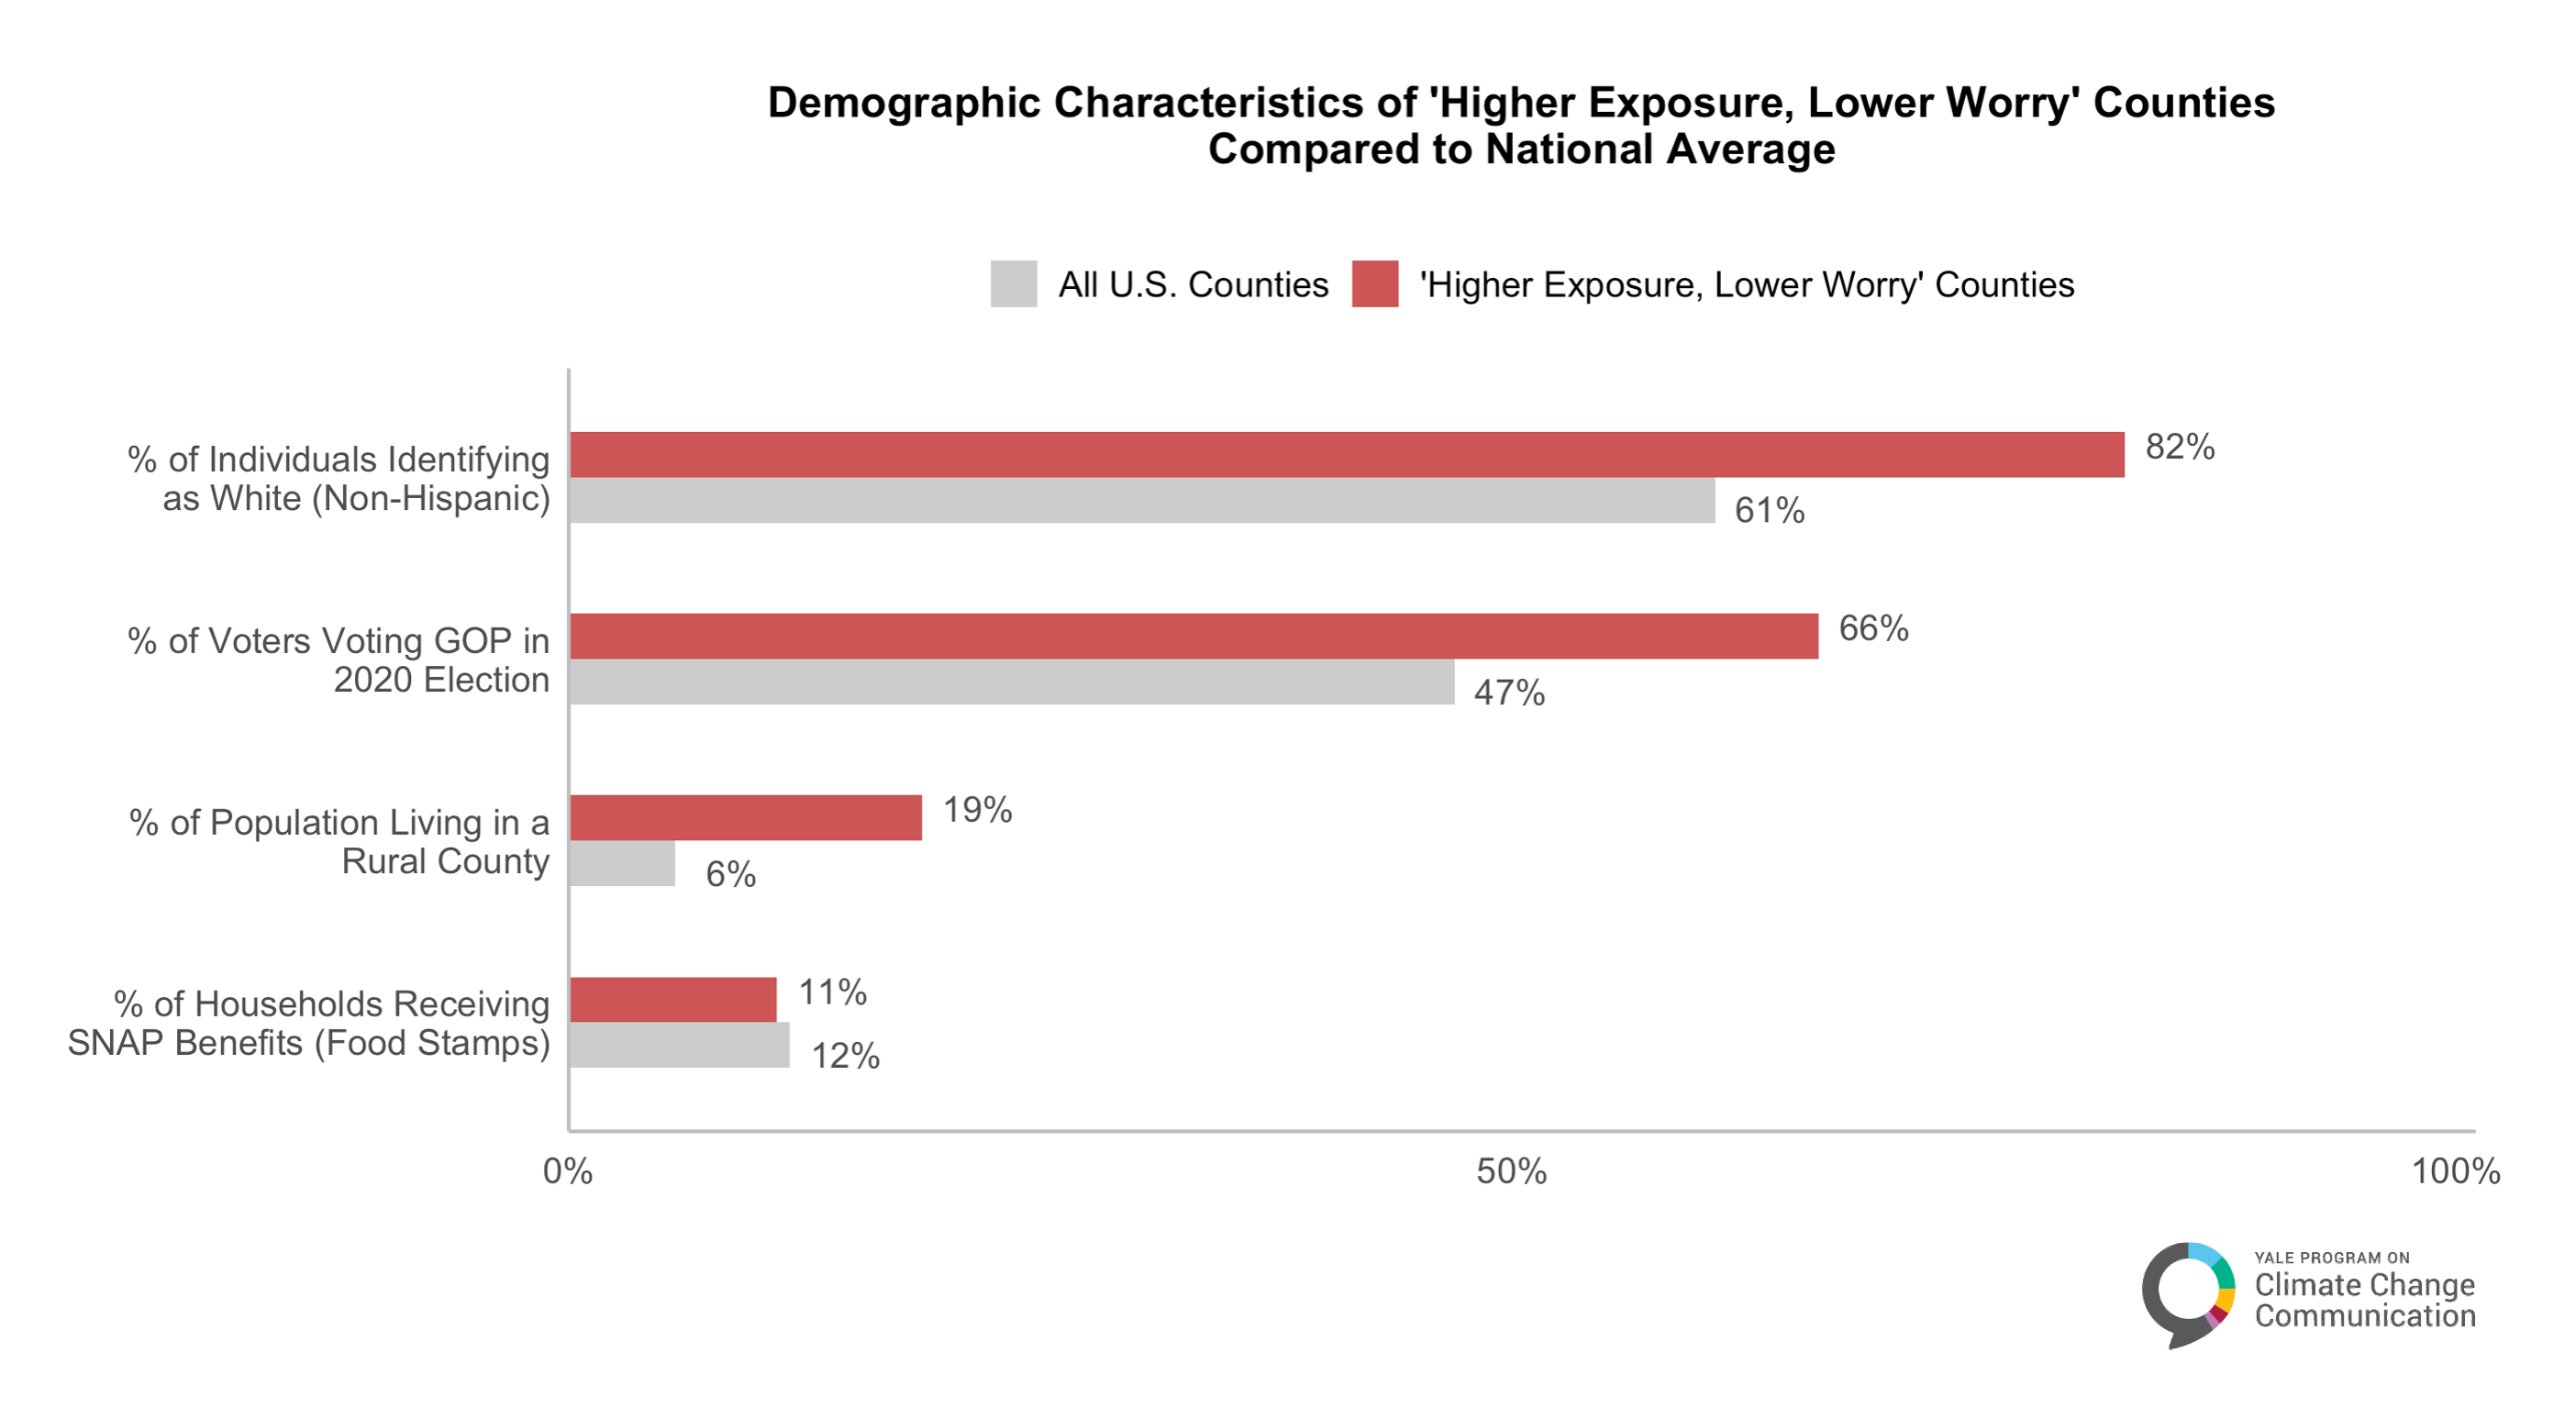
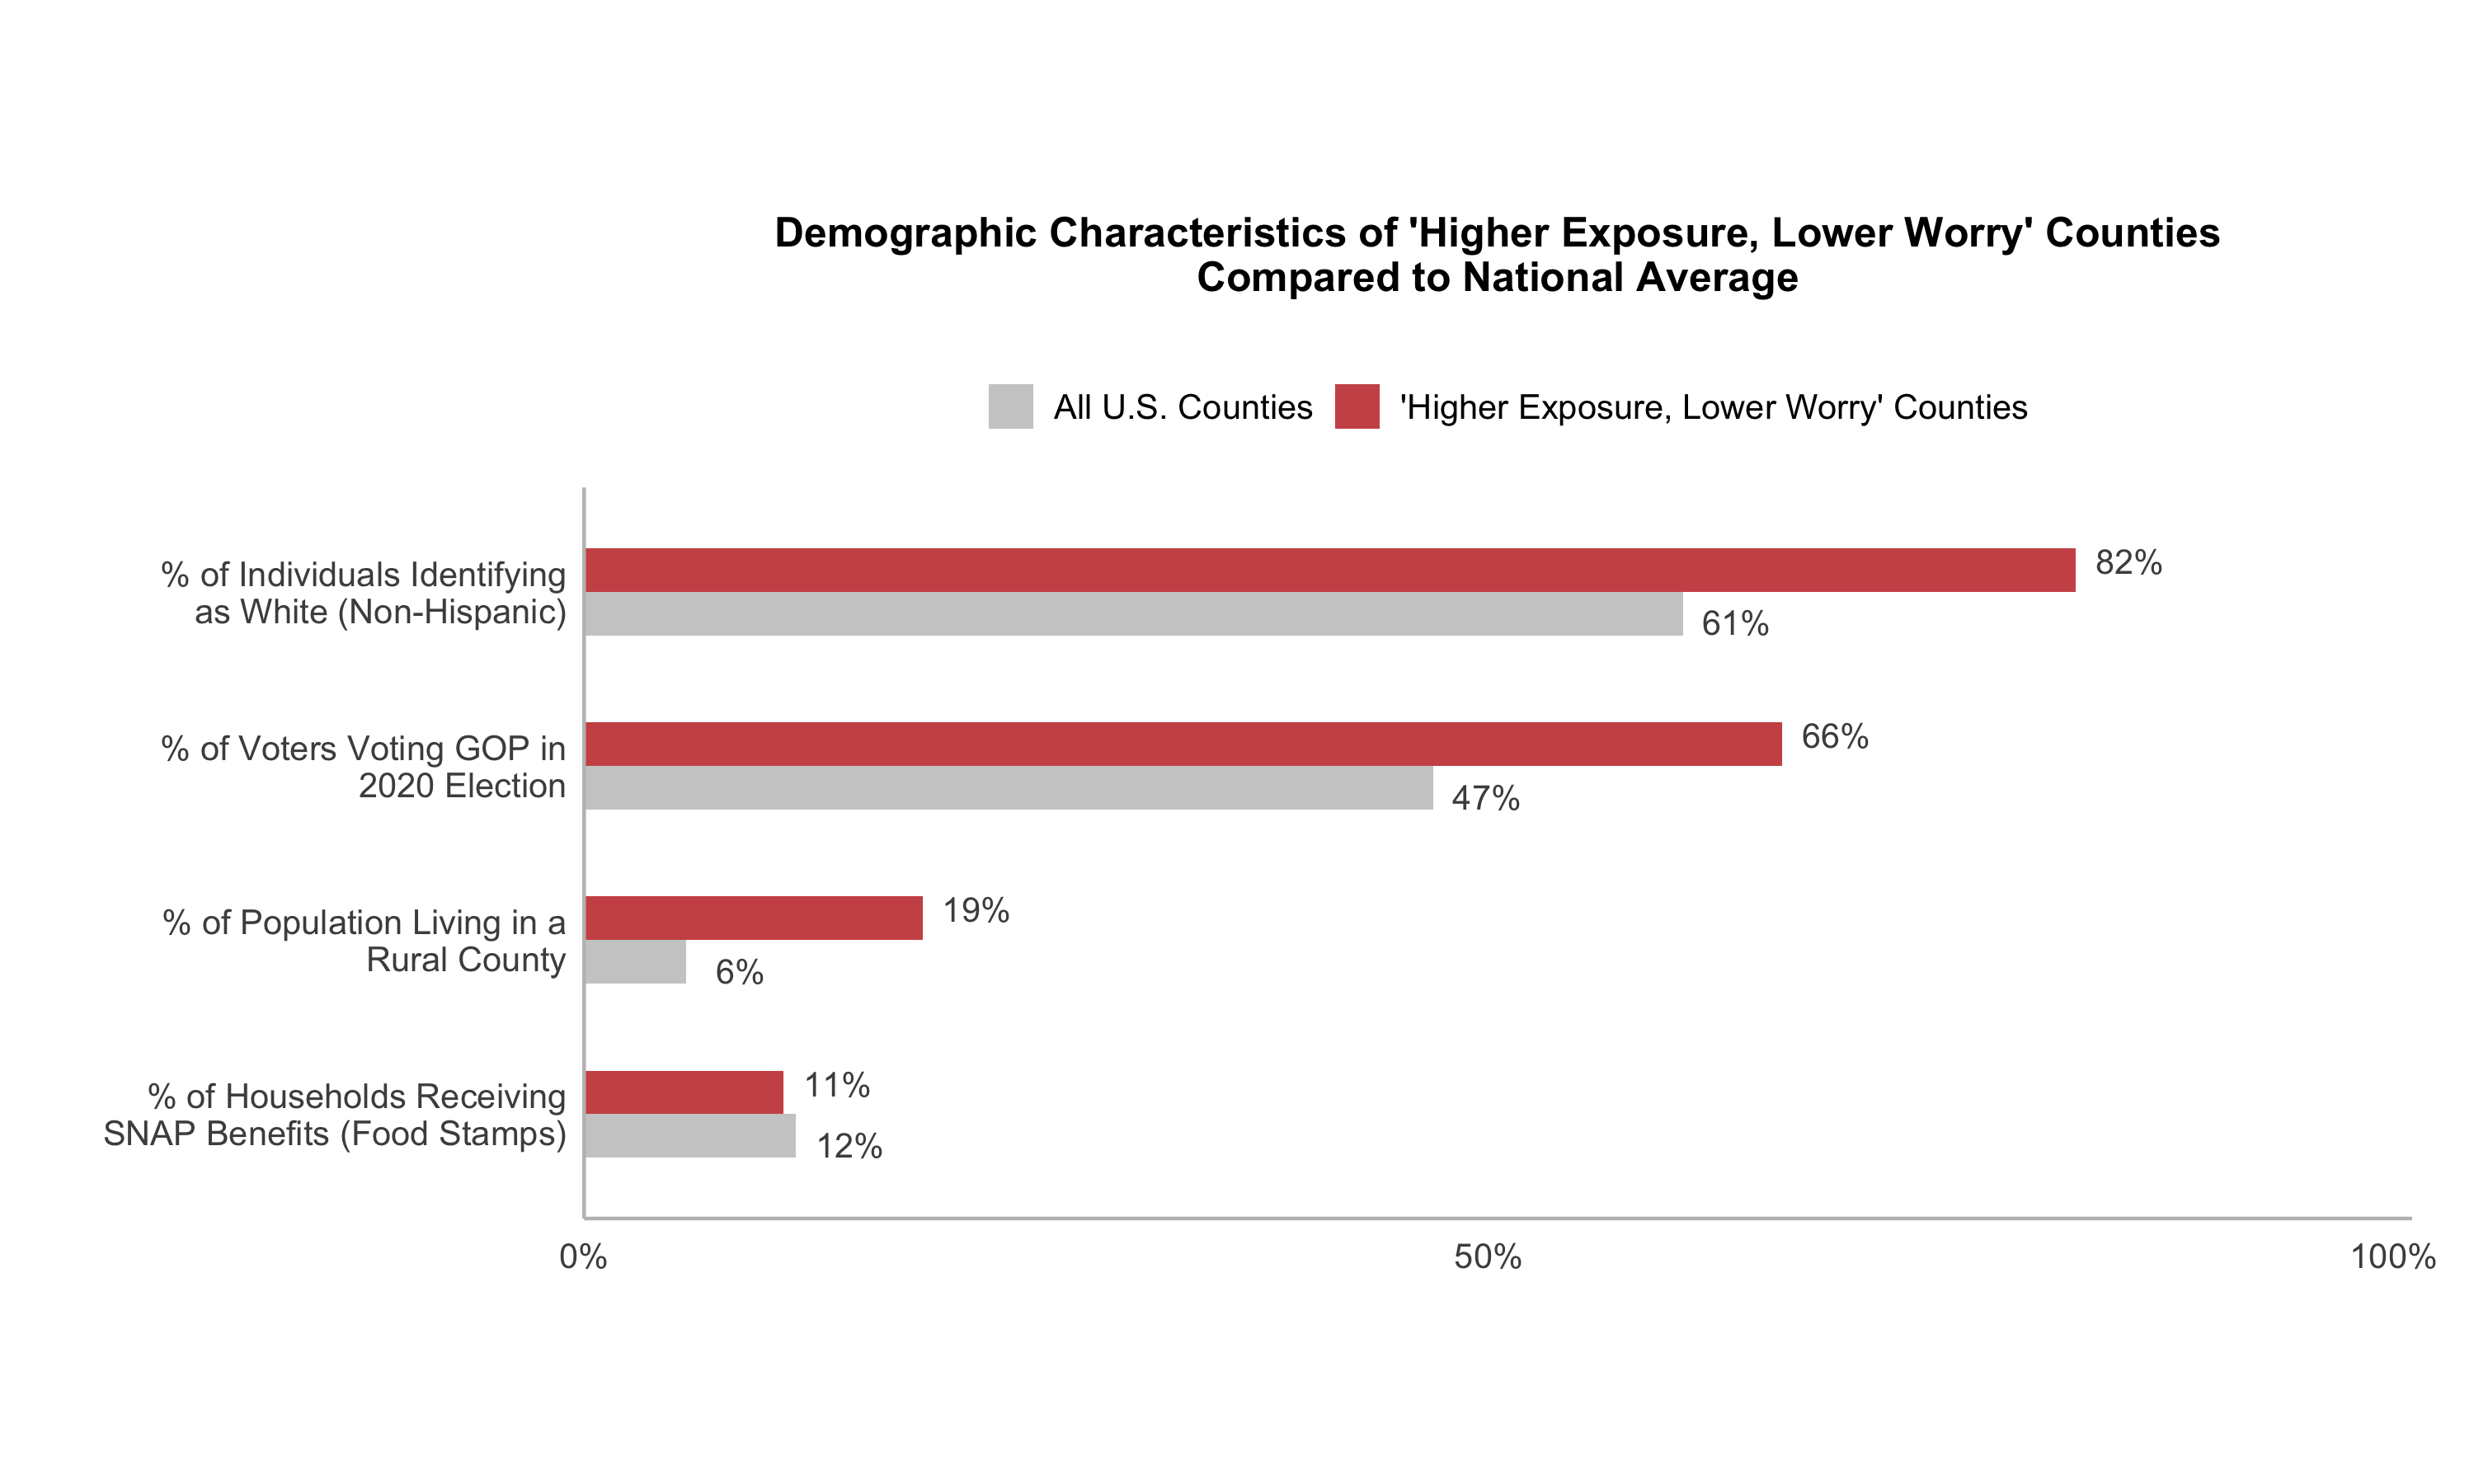
A population’s exposure to weather and climate-related hazards is only one of many factors that shape perceived risks of global warming. Age, education, political ideology, social norms, and other factors all influence individual perceptions. Likewise, socioeconomic trends, political context, the media, and other factors shape overall climate sentiment in different states and regions. We thus examined several demographic characteristics of these counties to see how they compare to the overall demographics of the United States.
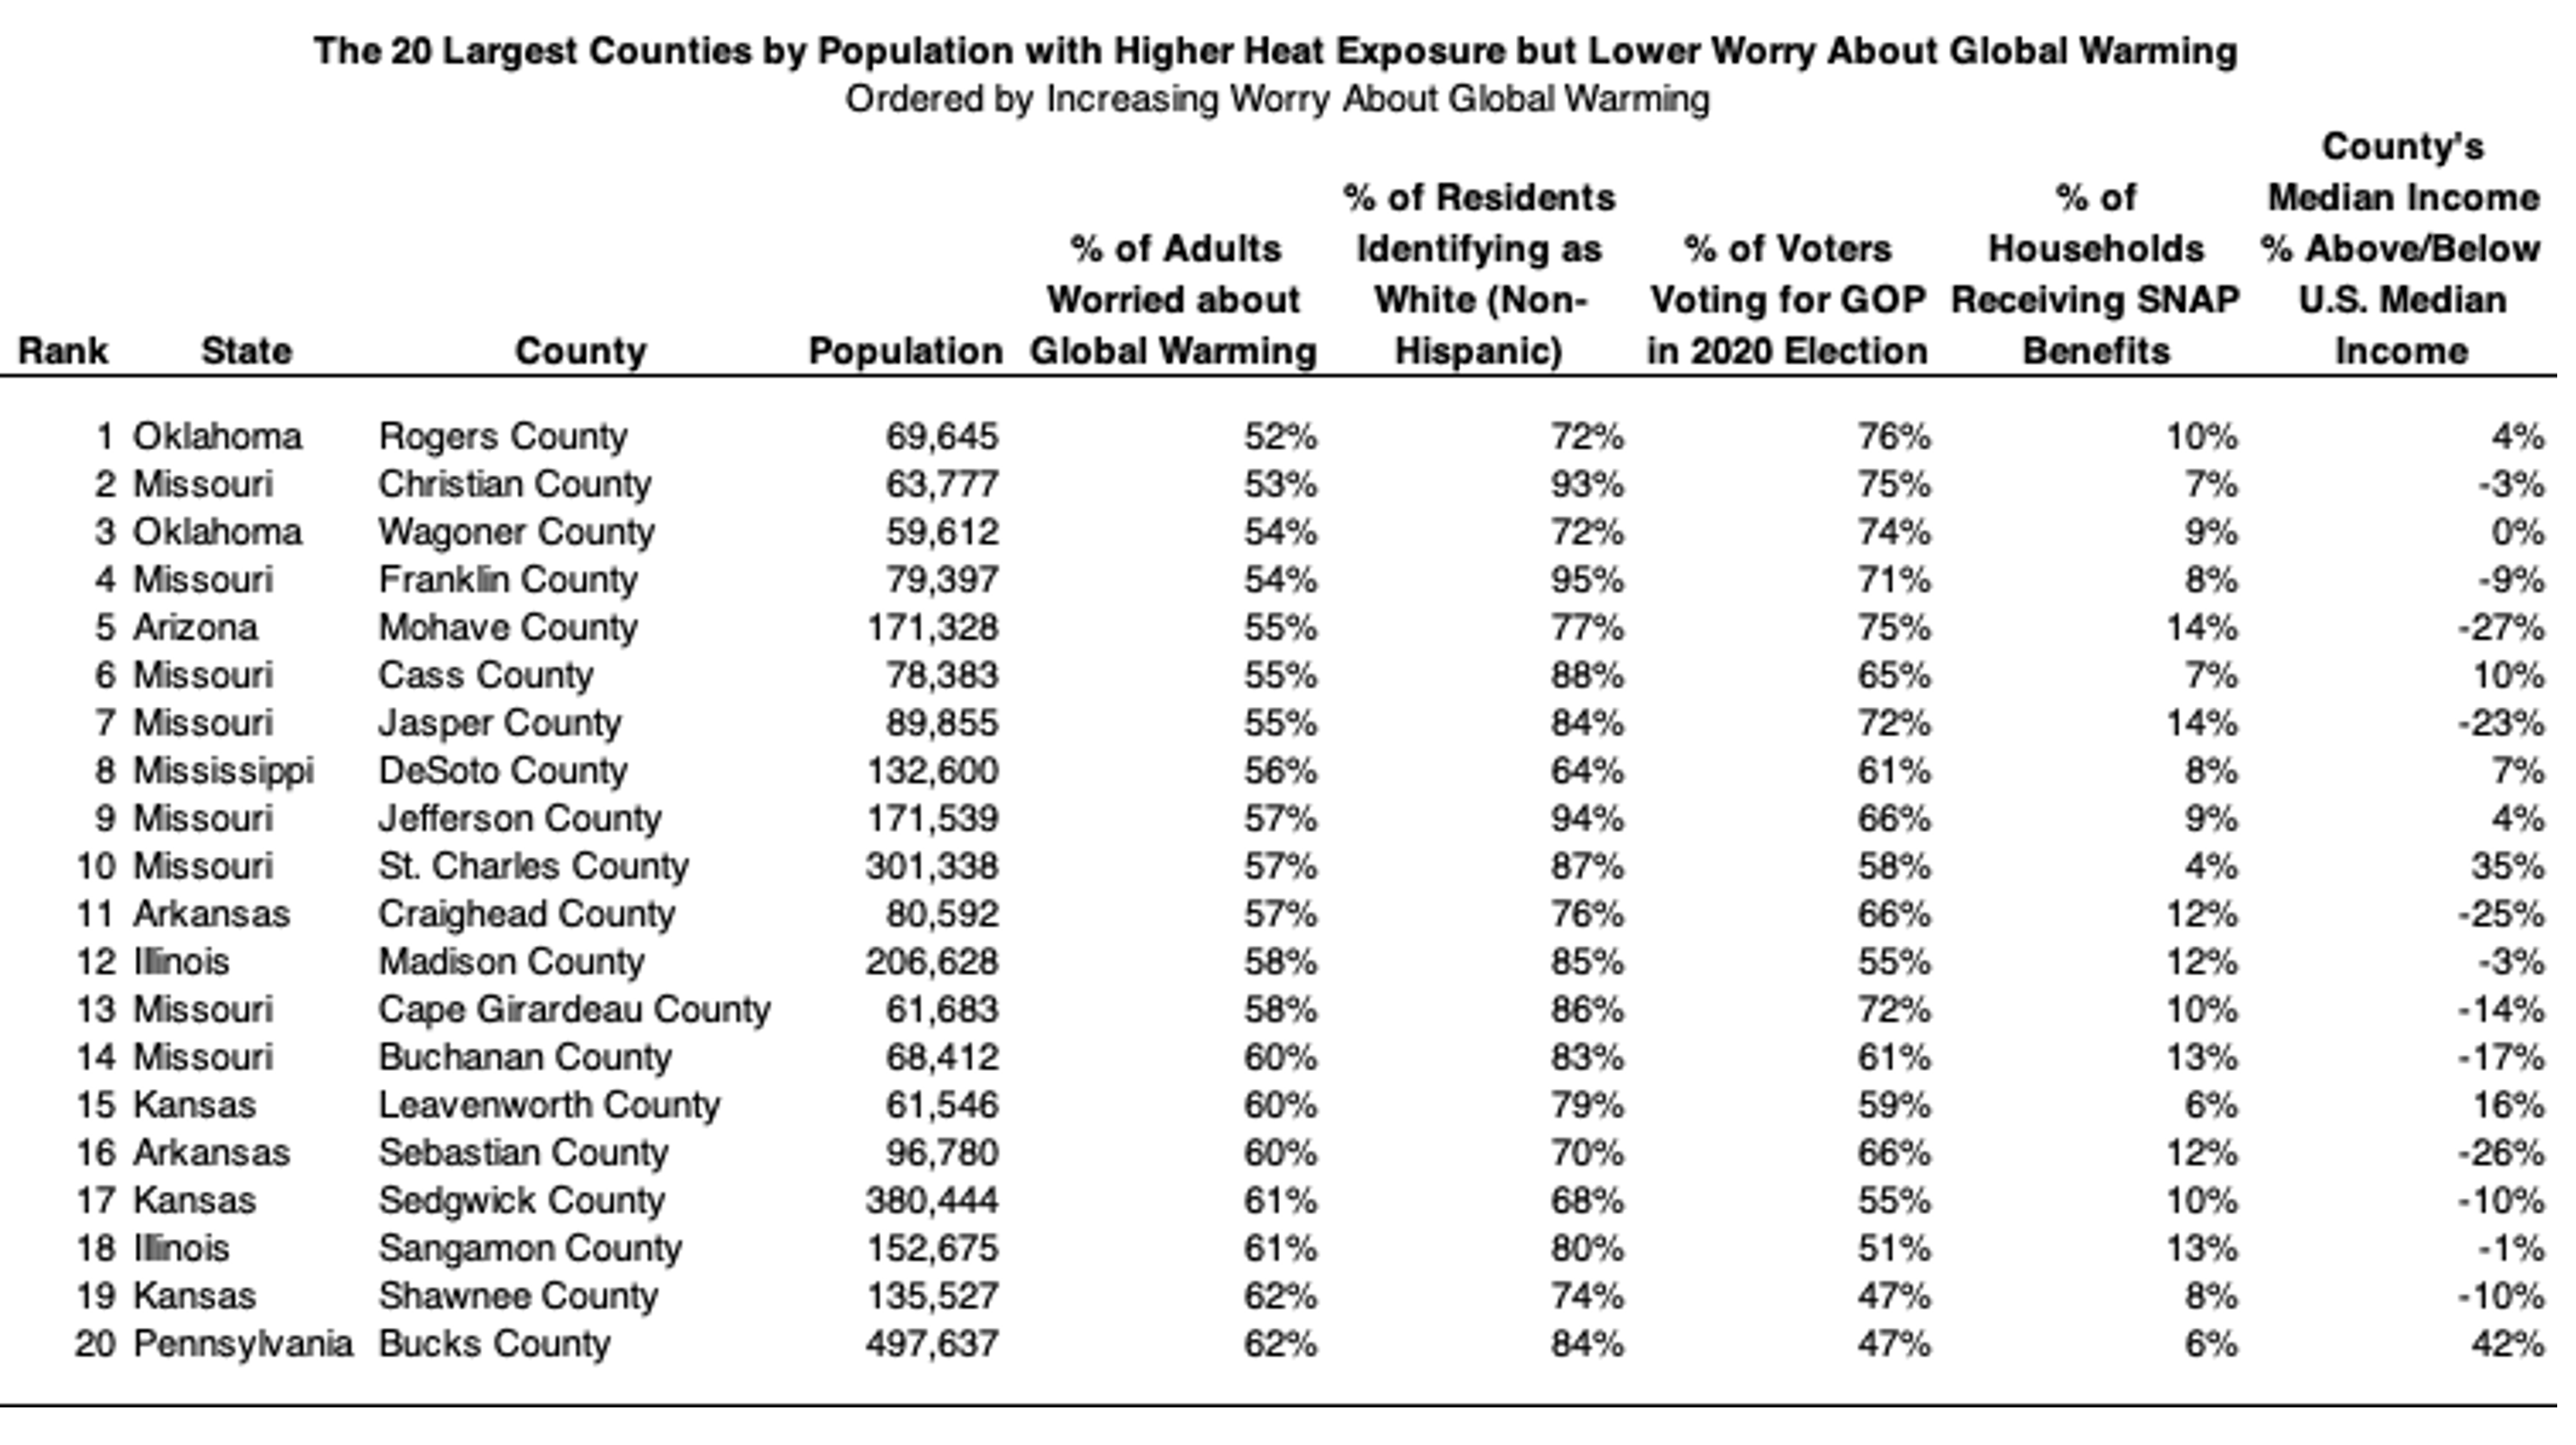
The 217 counties that fall into the “Higher Exposure, Lower Worry” quadrant of the scatter plot represent about 6.4M people (2.6% of U.S. population). Analysis of the socioeconomic characteristics of these counties show that they have a median household income of around $57K per year, which is about 9% below the overall median household income in the United States ($62K). Another socioeconomic metric, the percent of households receiving Supplemental Nutrition Assistance Program (SNAP) benefits (also known as Food Stamps), is one measure of poverty. In these 217 counties, around 11% of households receive SNAP benefits, which is in line with the U.S. national average (12%) and suggests no significant economic disparities between this group and the U.S. population overall.
However, residents of the 217 counties in the “Higher Exposure, Lower Worry” quadrant are much more likely to identify as white, to have voted Republican in the 2020 presidential election, and to live in a rural county compared to the U.S. population overall. These counties are almost exclusively located in the Midwest or the South and are also generally smaller in population than most other counties included in this analysis. However, it is important to recall that many counties in the western United States are missing heat data and are therefore excluded from this analysis. A table in the appendix, below, provides a list of the largest 20 counties in this group by population along with the demographic characteristics discussed above.
Record-breaking heat events are already increasing, and heat stress multiplies the risk of a number of other health conditions. Policymakers, government officials, educators, and others must consider the varying factors that influence public worry about global warming, especially since public disaster awareness and risk perceptions can support preparedness behaviors. Populations that fail to accurately perceive extreme heat threats will be less prepared for heat waves and therefore at higher risk of death and serious illness from extreme heat, which is very likely to increase in frequency and severity due to global warming.
Thus, it is imperative that research continue to explore effective ways to prepare people for more frequent and intense natural disasters, even in the face of global warming doubts and denial. By identifying U.S. counties that are less worried about global warming but have faced higher exposure to extreme heat, we hope to underscore the importance of tailoring global warming responses and policies to meet local and regional needs.
The model estimates and FEMA data underlying this analysis are available online, and we hope they are of use to communicators, health officials, academics, and others who are working to promote safe behaviors during heat waves, broader community resilience to heat, global warming adaptation efforts, and overall community health and wellbeing during these times of climate crisis.
