Report · May 16, 2024
Climate Change in the Indian Mind, 2023
By Anthony Leiserowitz, Jagadish Thaker, Marija Verner, Emily Goddard, Jennifer Carman, Seth Rosenthal, Naga Raghuveer Modala, Mallika Talwar, Yashwant Deshmukh, Gaura Shukla, Jennifer Marlon, Matthew Ballew and Matthew Goldberg
Filed under: Behaviors & Actions and Beliefs & Attitudes
7. Vulnerability
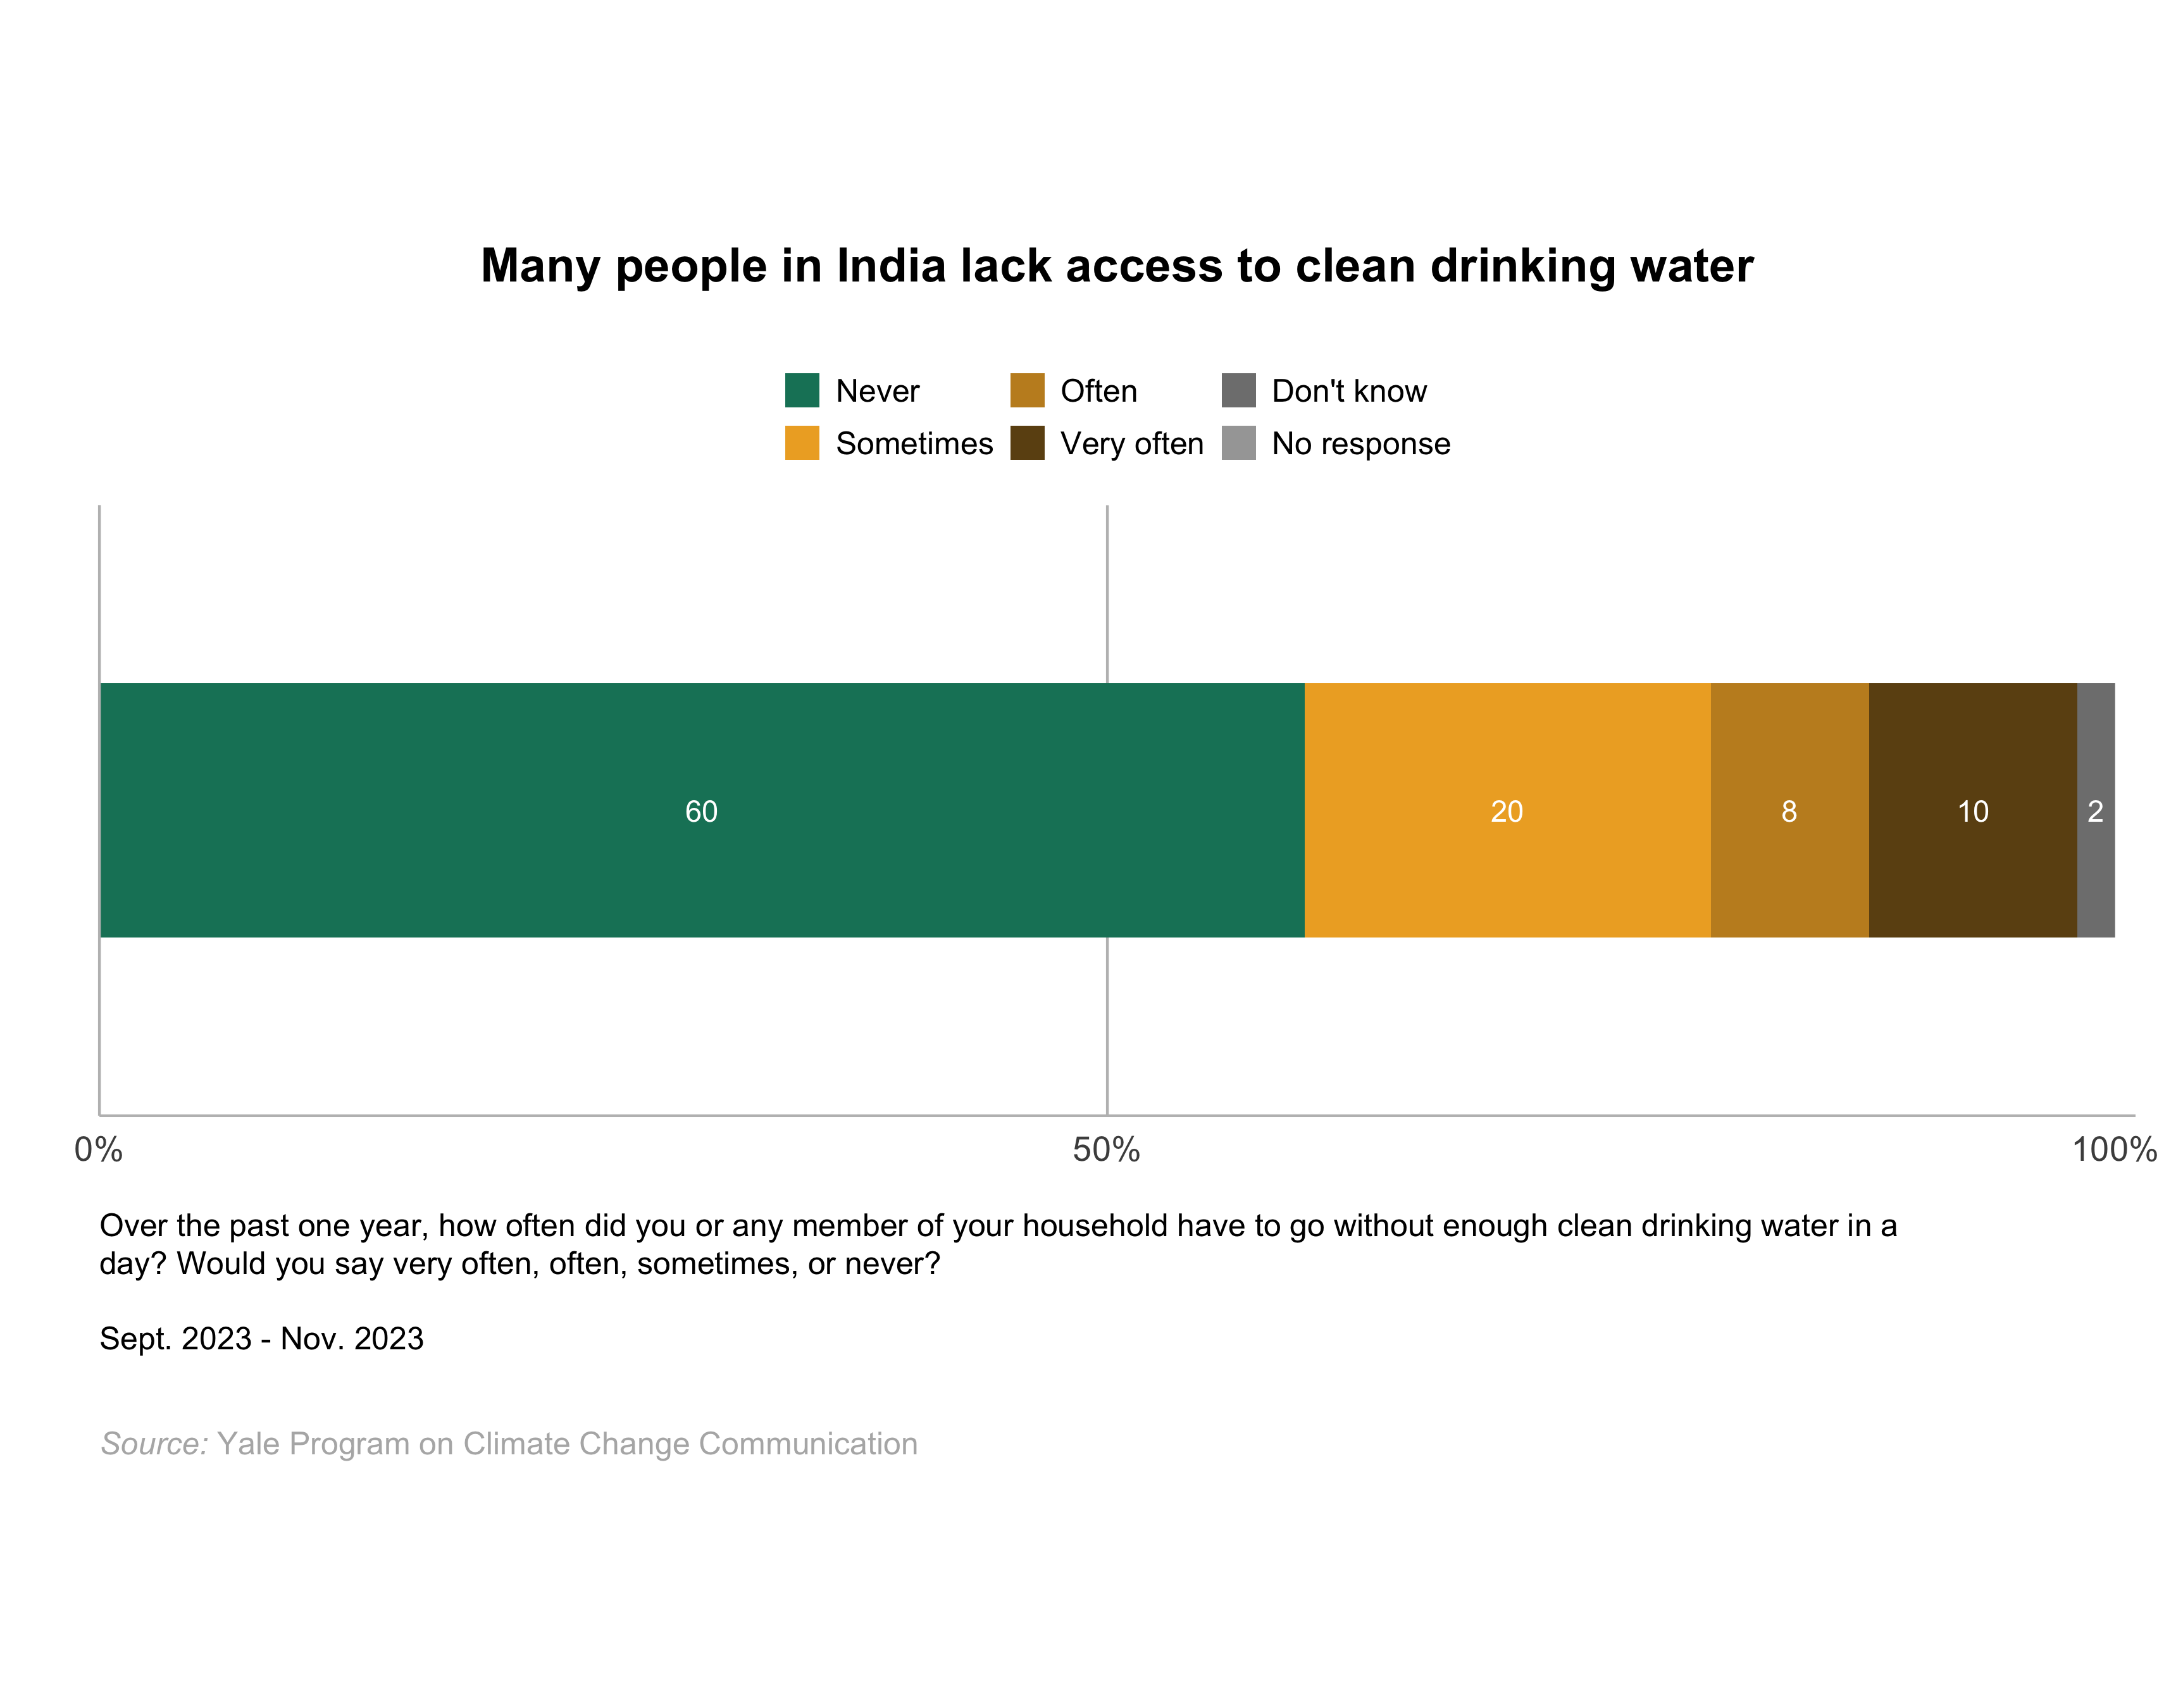
7.1 Many people in India lack access to clean drinking water.
Respondents were asked how often they or any member of their household had to go through the day without enough clean drinking water over the past year. Ten percent say it happened “very often,” 8% “often,” and 20% “sometimes,” while six in ten people in India (60%) say they or their household members have “never” faced this issue in the past year.
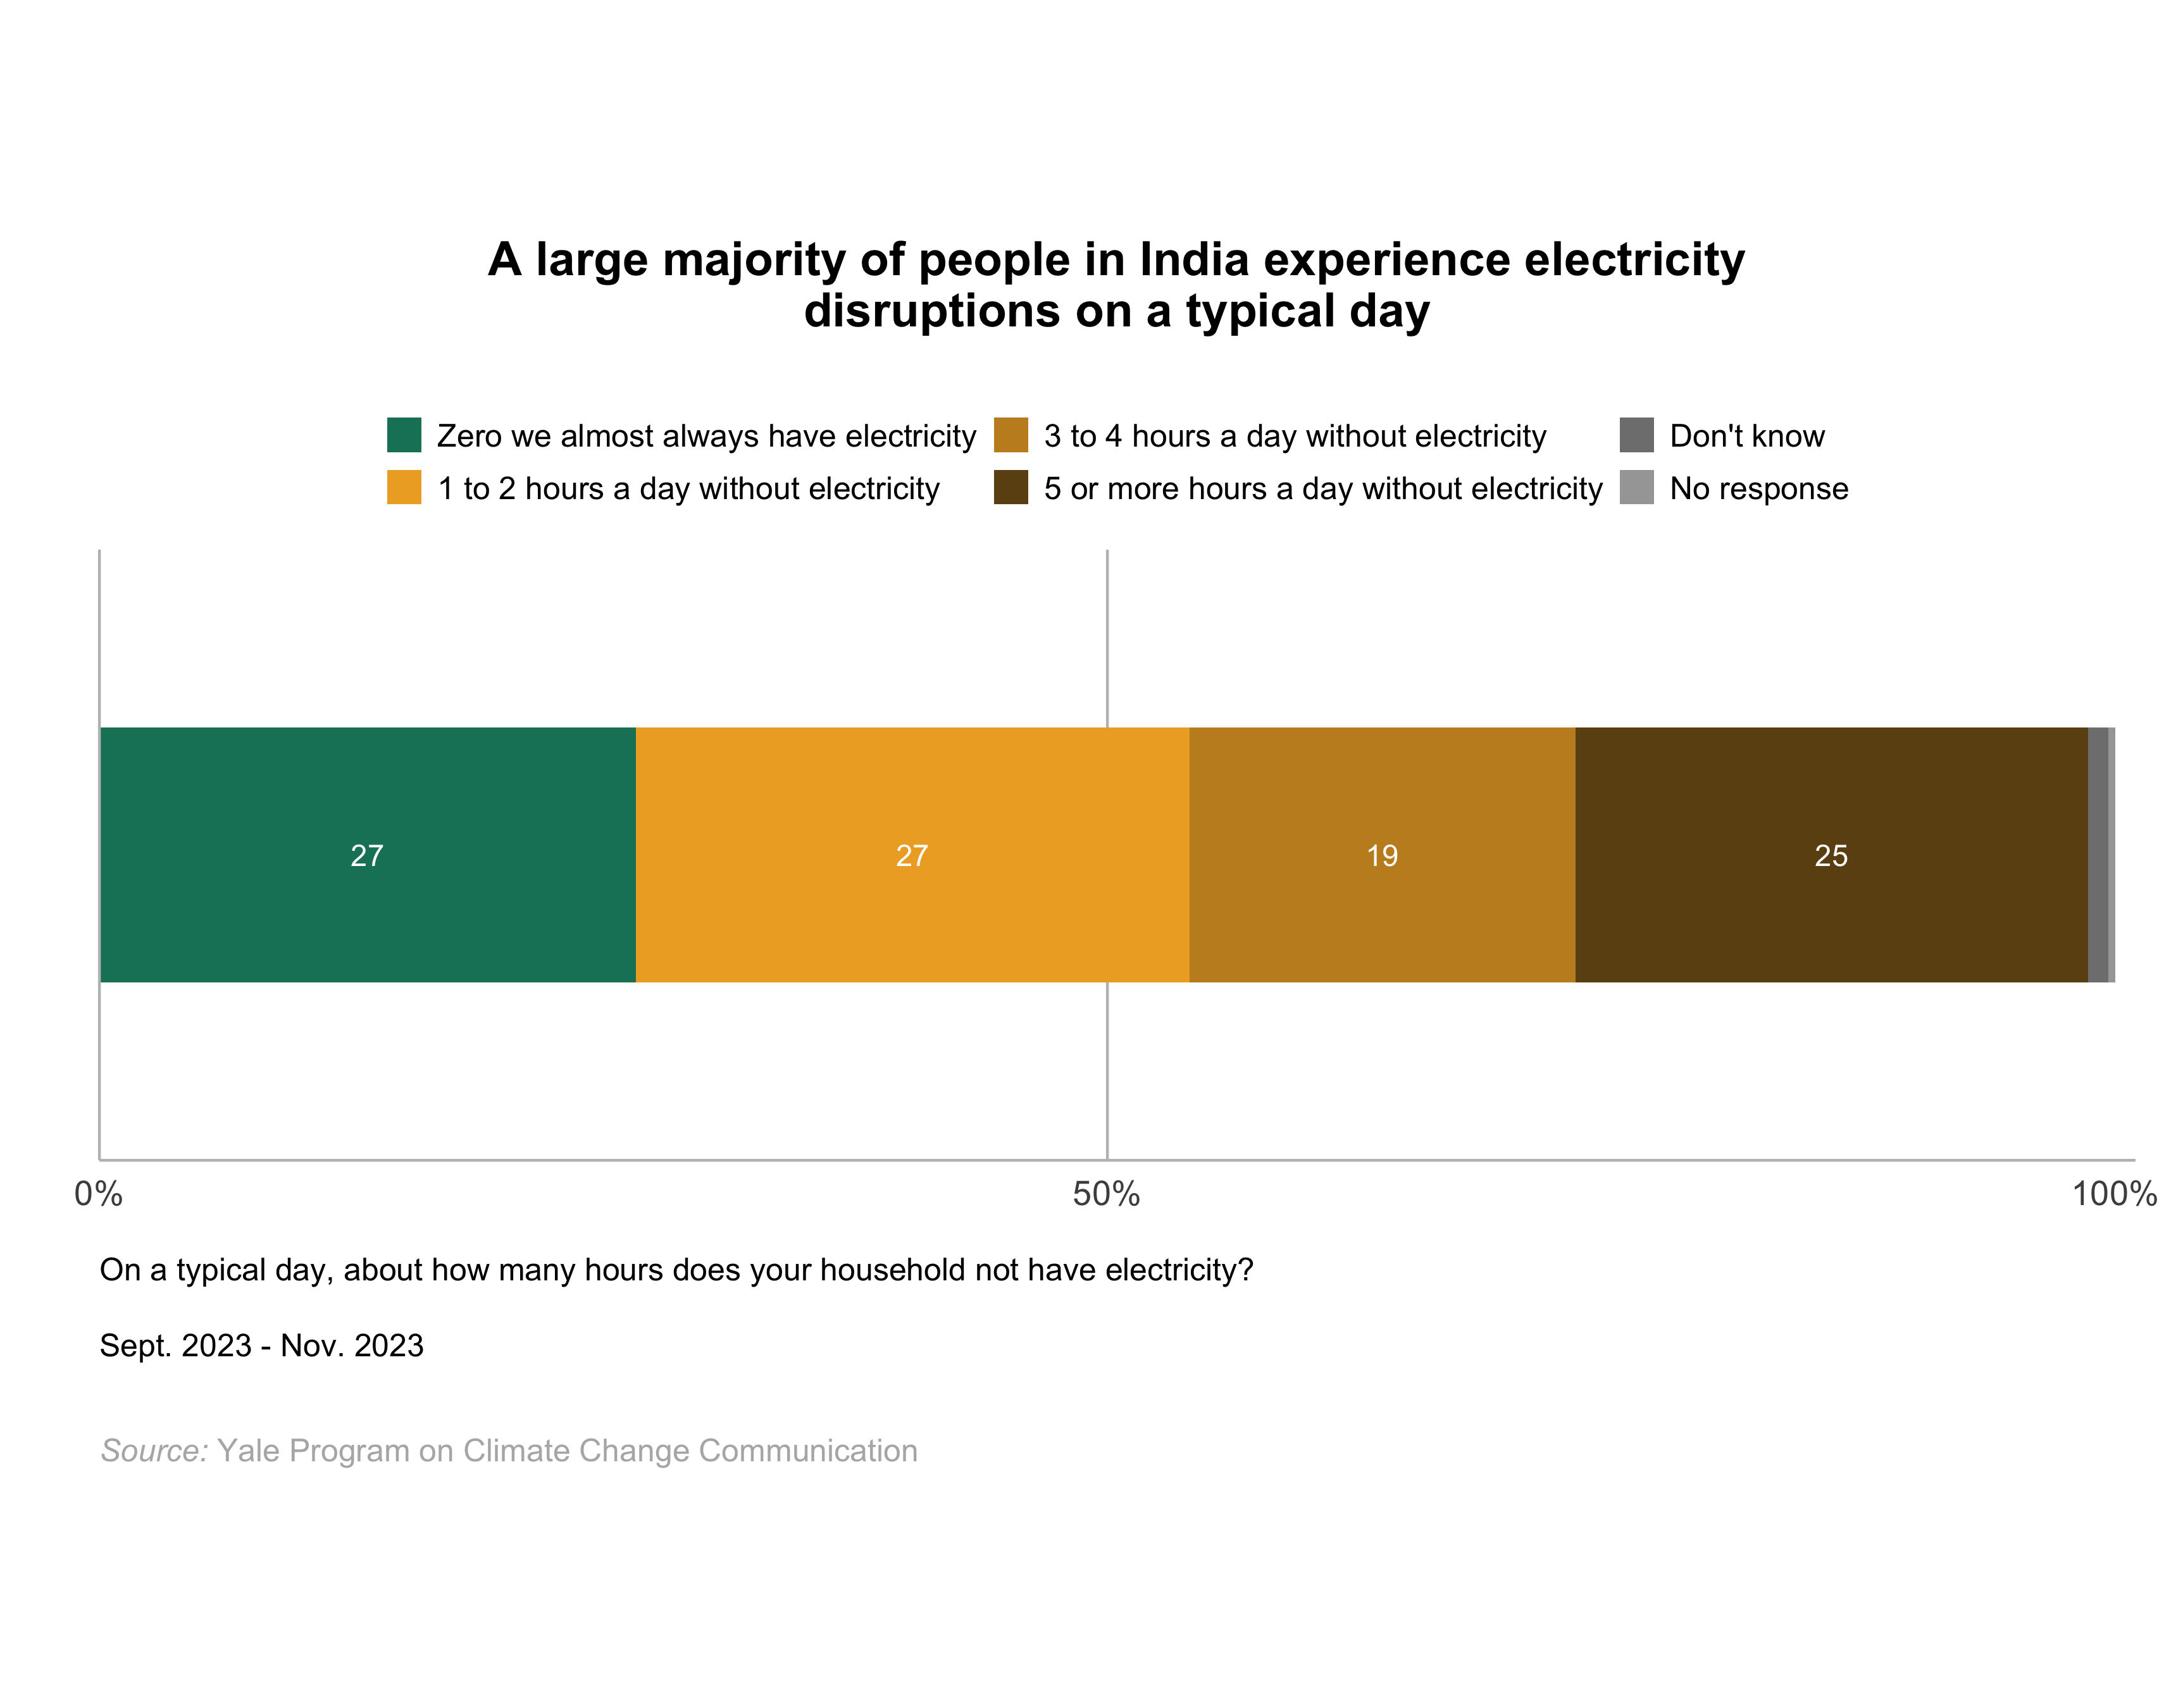
7.2 A large majority of people in India experience electricity disruptions on a typical day.
A large majority of people in India (72%) experience electricity disruptions on a typical day. Twenty-seven percent say their household goes “1 to 2 hours a day without electricity,” 19% say they go “3 to 4 hours a day without electricity,” and one in four (25%) say their household goes “5 or more hours a day without electricity.” Only about one in four (27%) people in India “almost always have electricity” on a typical day.
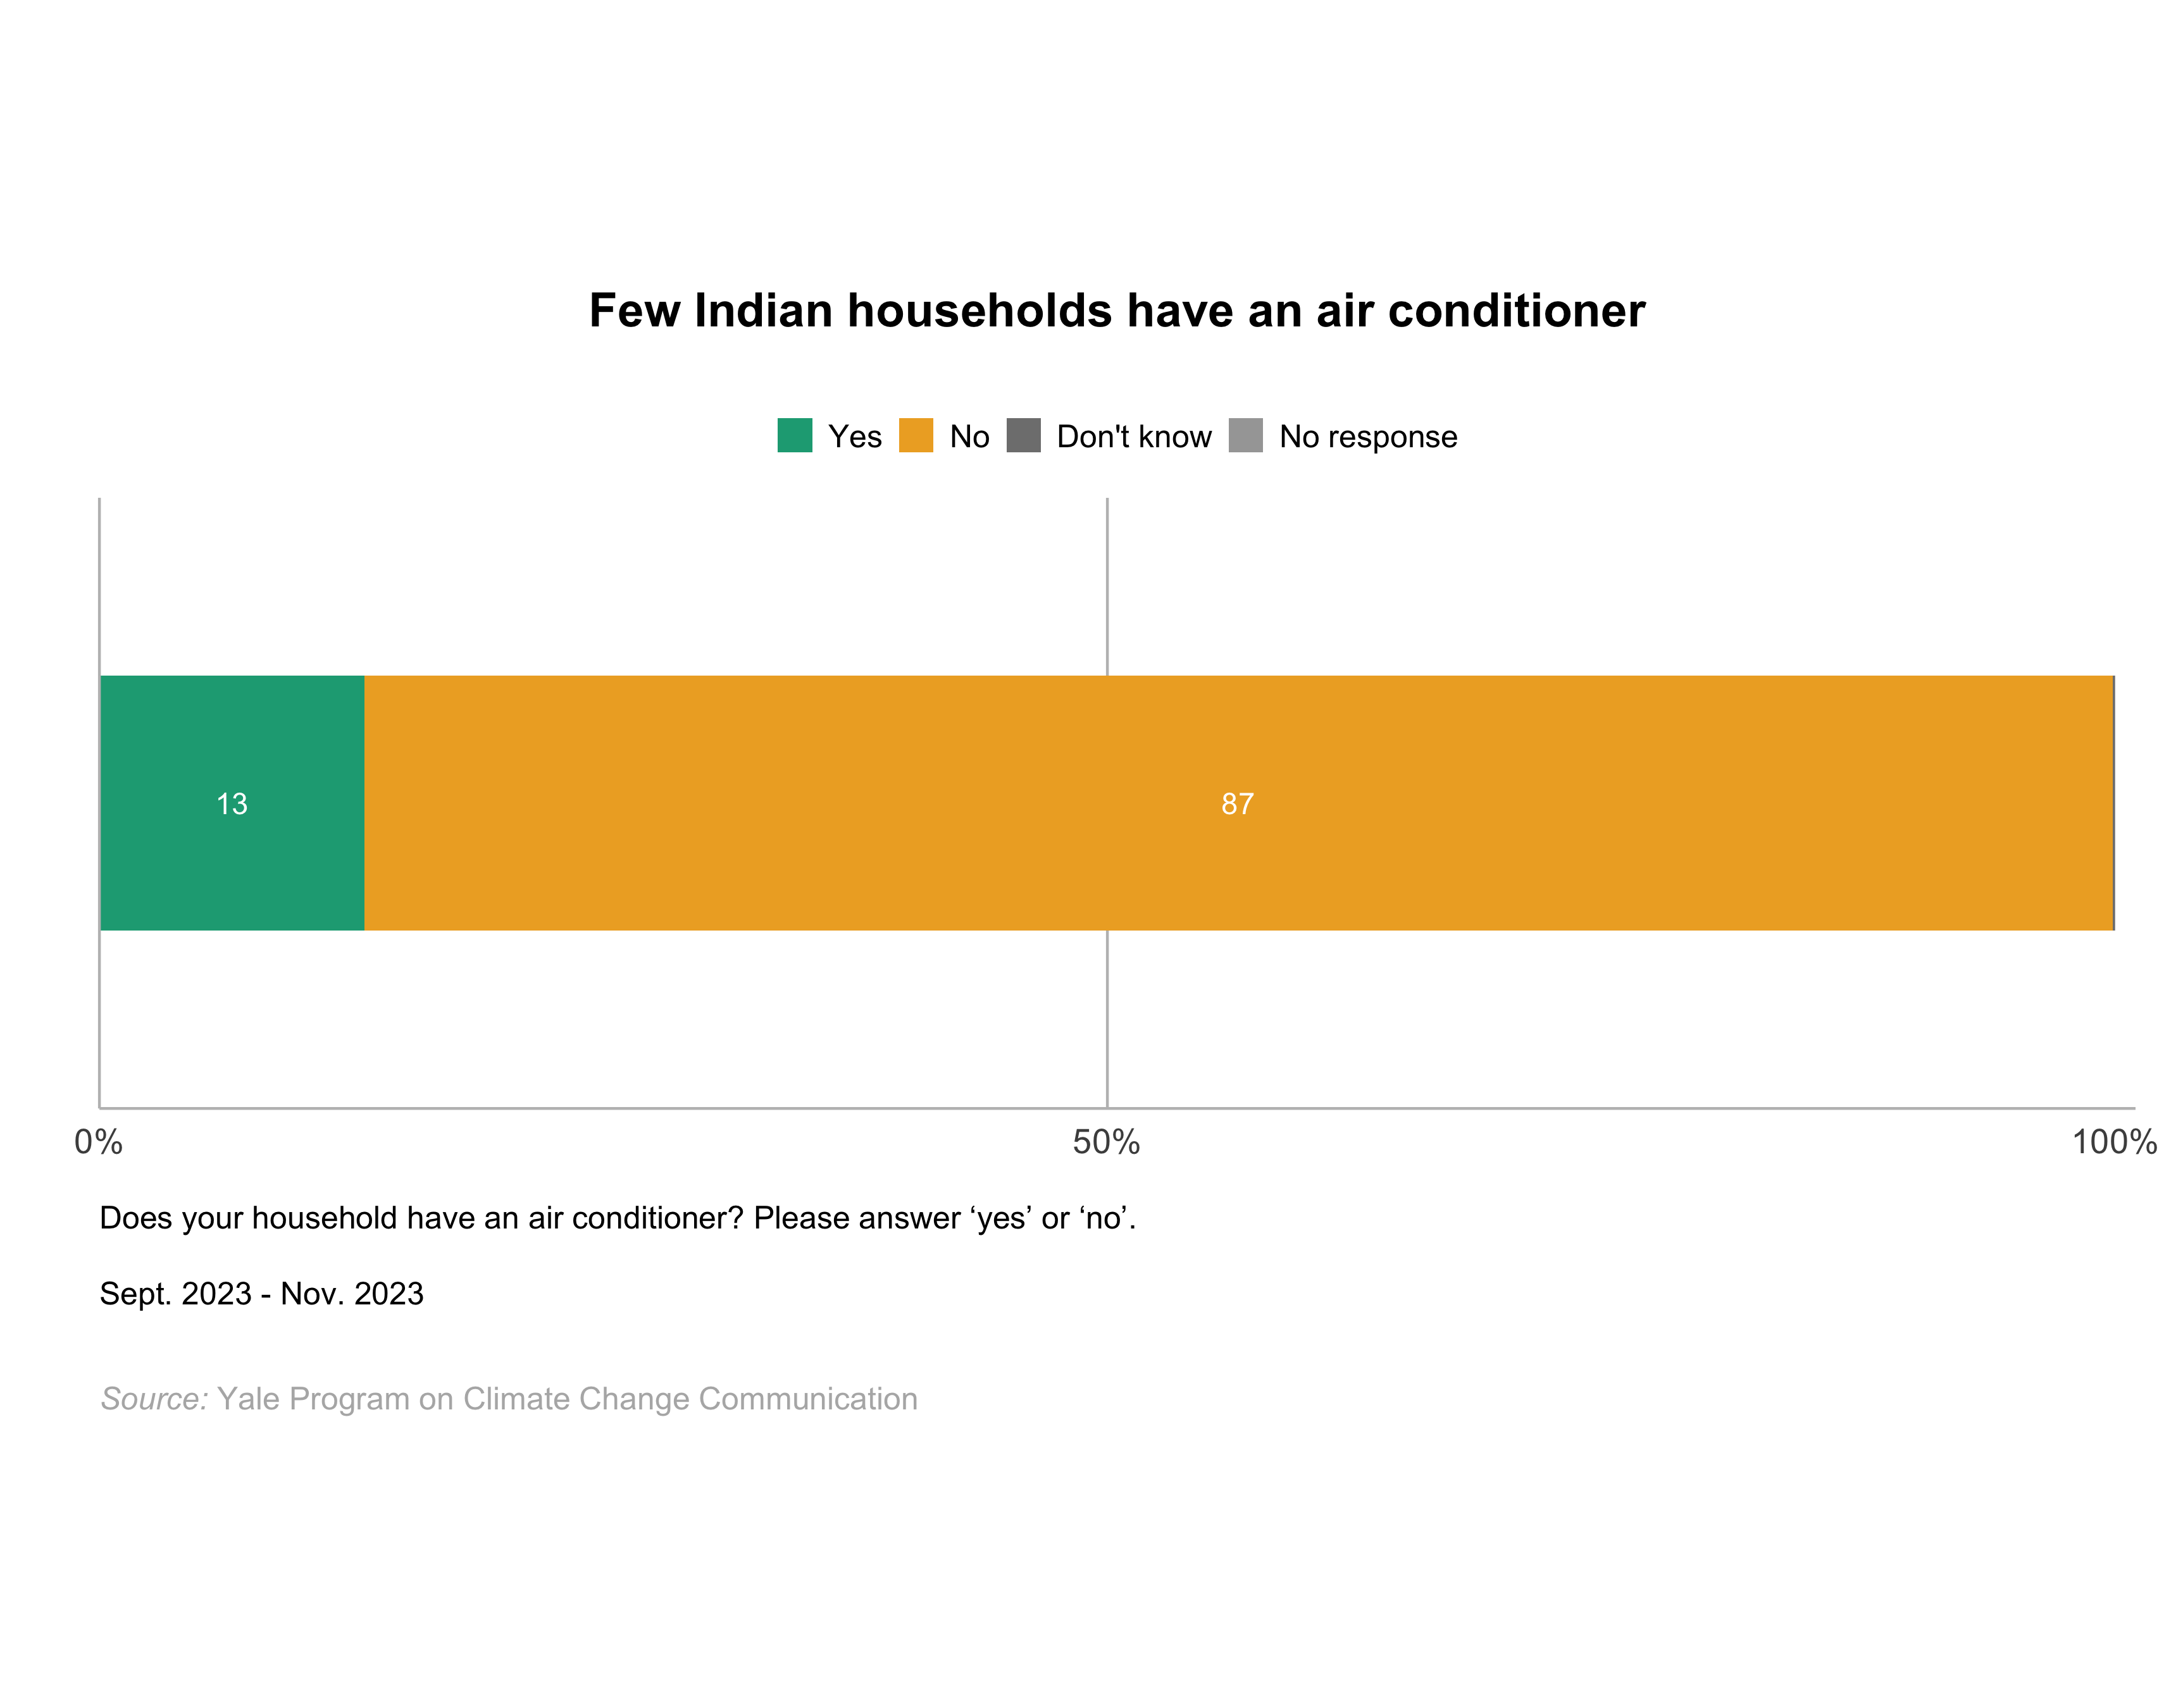
7.3 Few Indian households have an air conditioner.
Only 13% of people in India say their household has an air conditioner. By comparison, 87% say they don’t have an air conditioner.
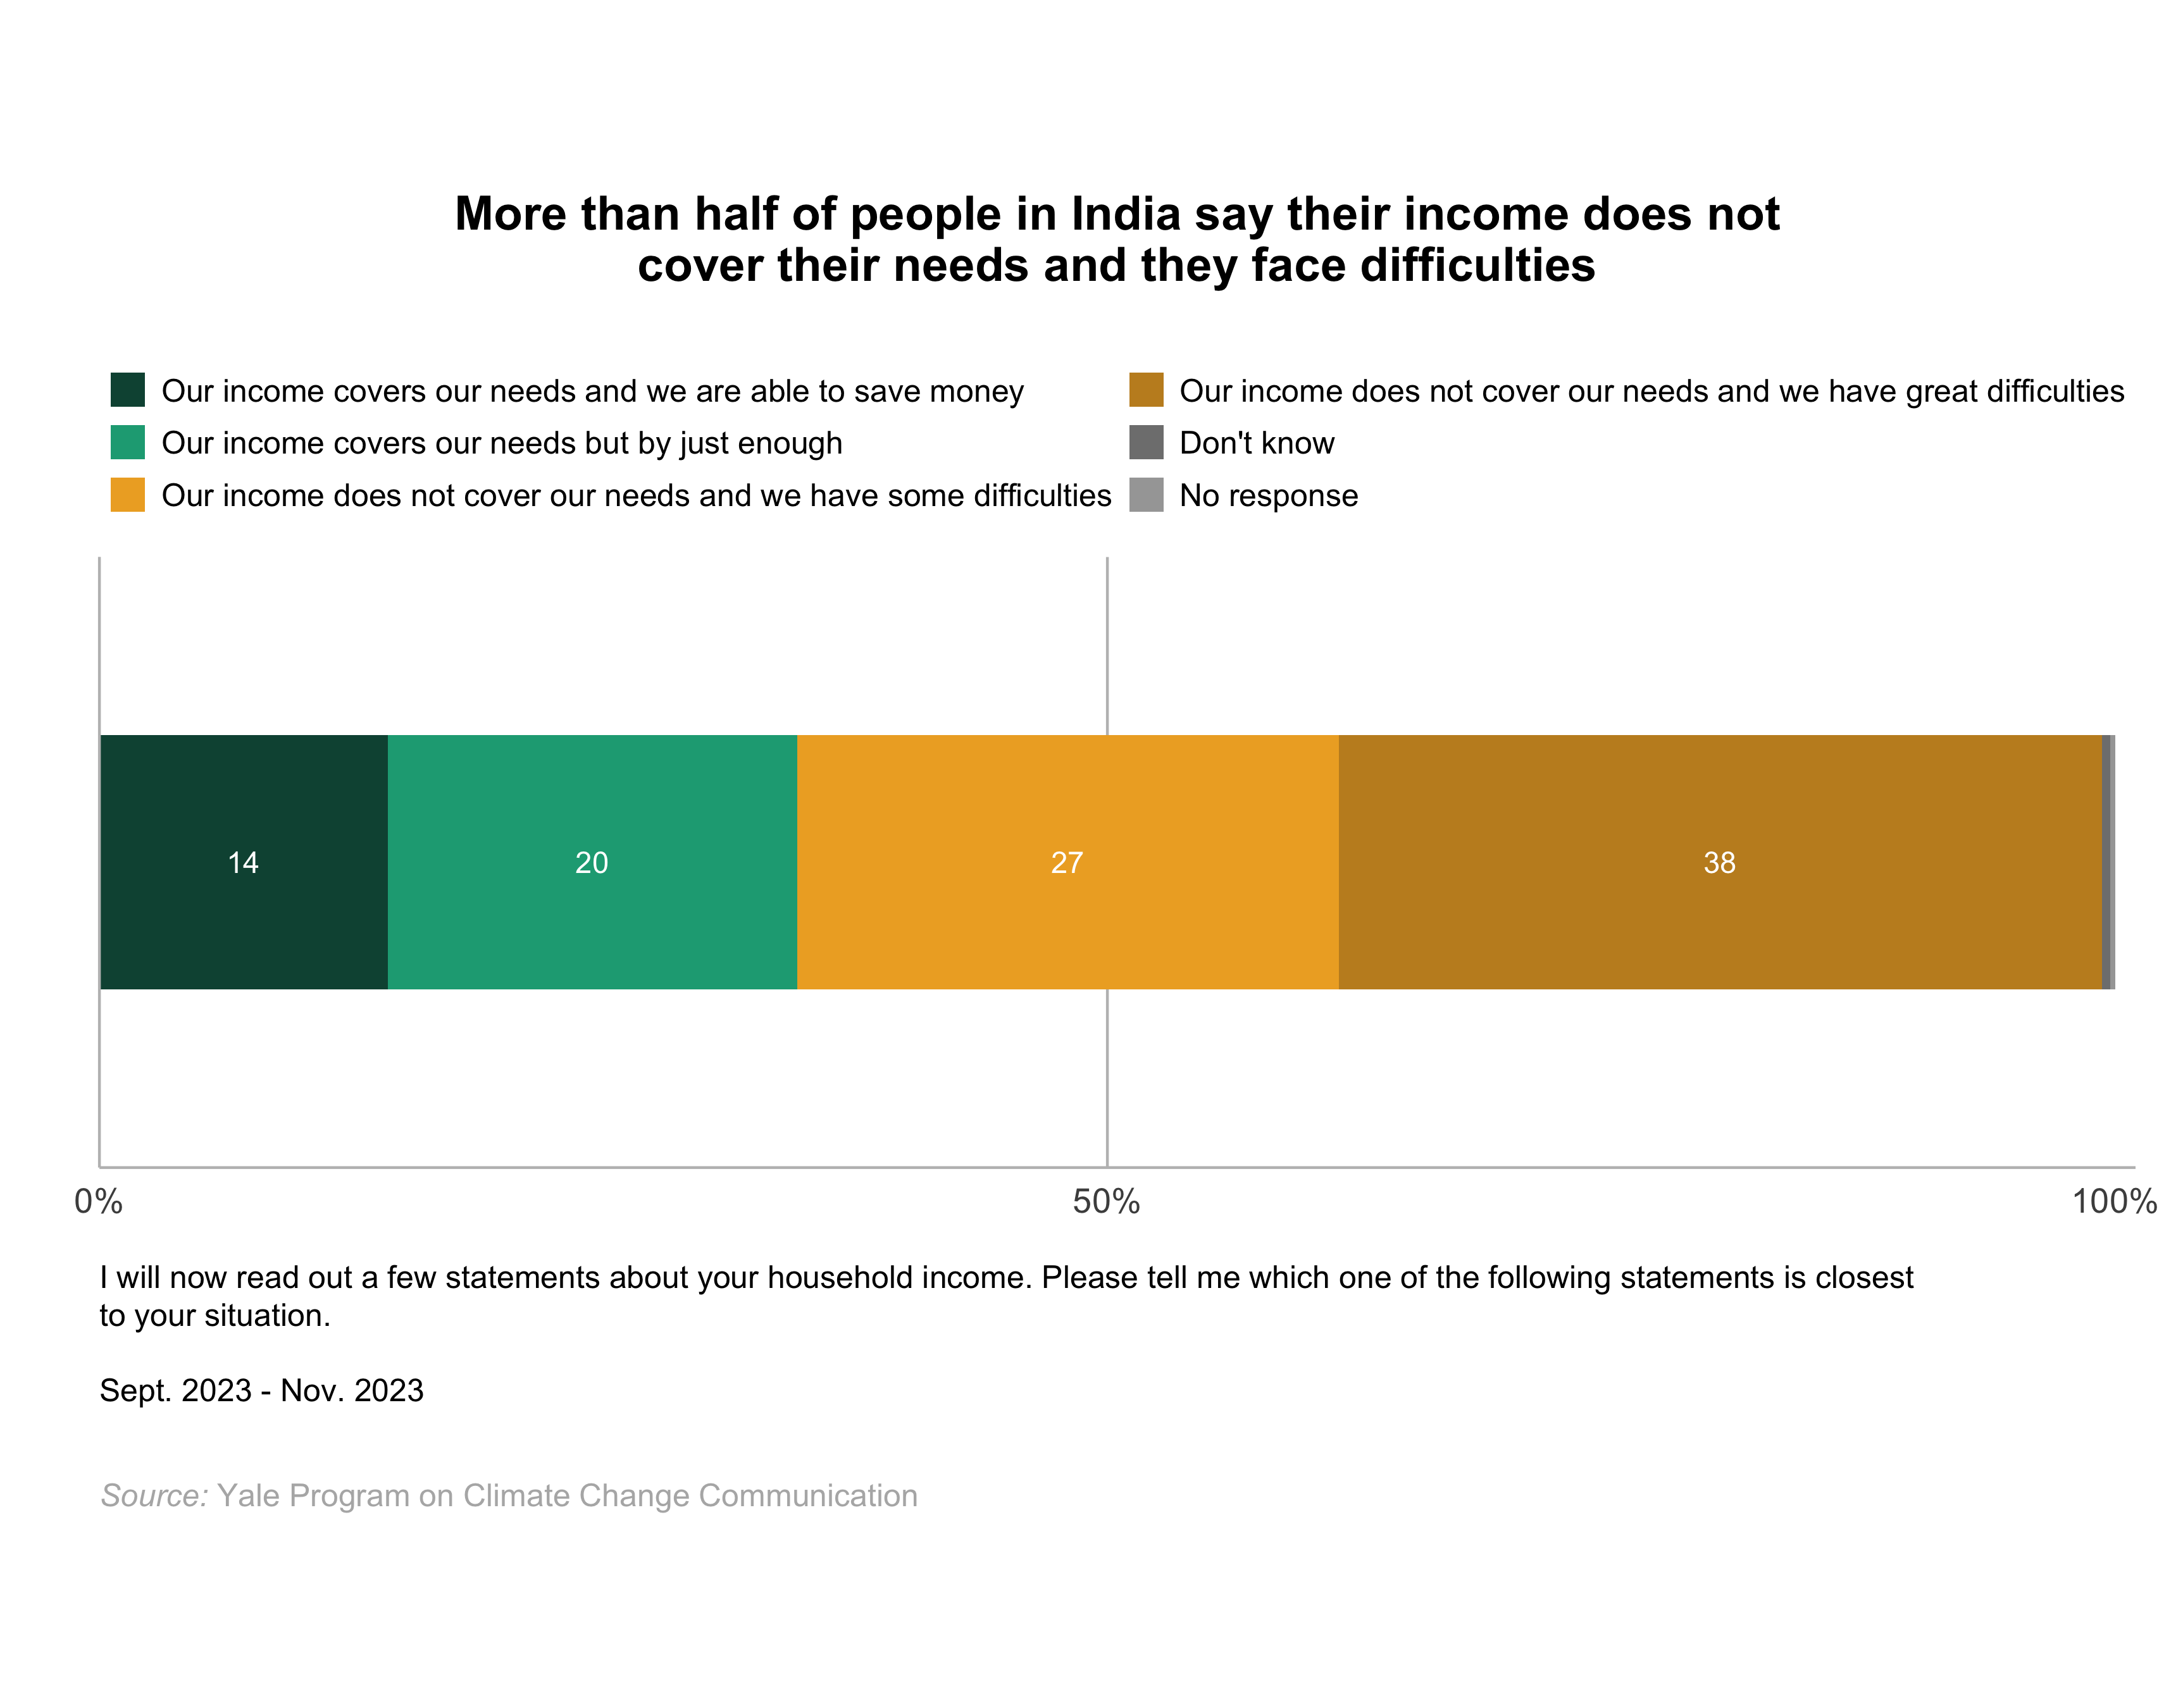
7.4 More than half of people in India say their income does not cover their needs and they face difficulties.
Only 14% of people in India say their household income covers their needs and they are able to save money, and another 20% say their income covers their needs, but by just enough. In contrast, more than half of people in India say their income does not cover their needs and that they either have “some difficulties” (27%) or “great difficulties” (38%).
The percentage of people in India who say their income does not cover needs and they have great difficulties is 11 percentage points higher than it was in 2021–2022.
Despite struggling to manage family and household budgets, a majority are willing to pay more for appliances and vehicles that are more energy-efficient and help curb global warming (refer to Sections 6.2 & 6.3).
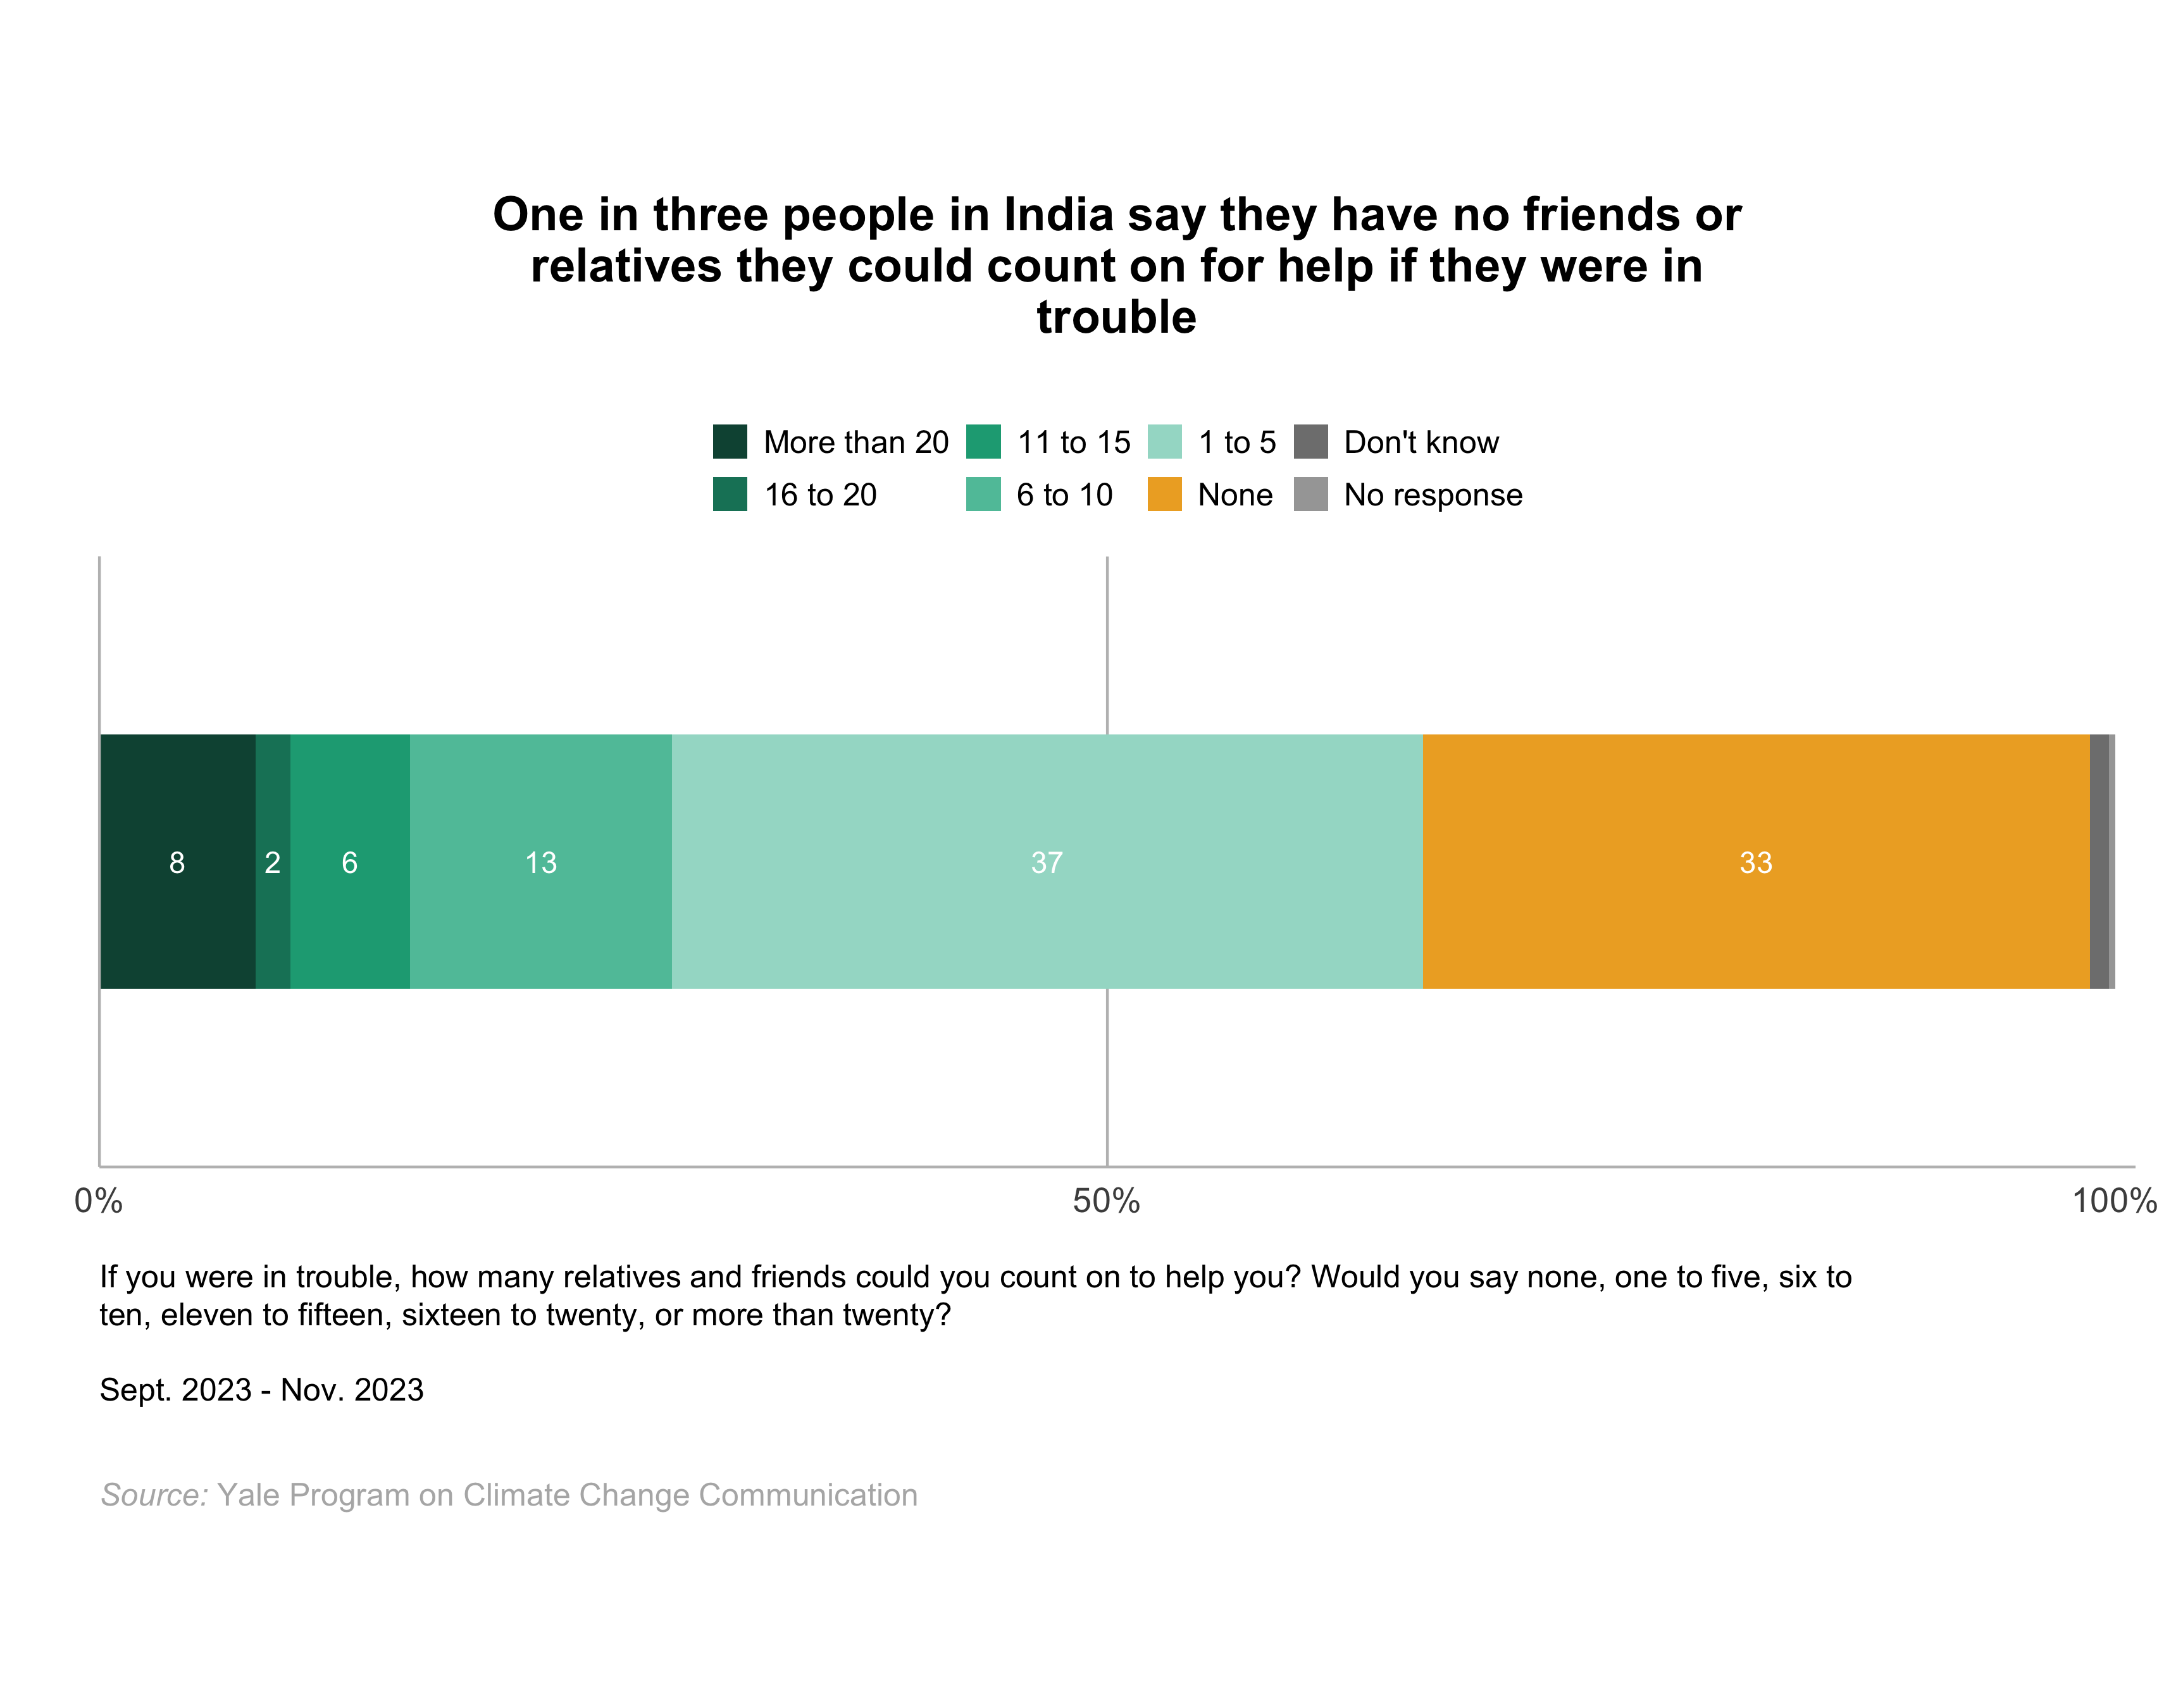
7.5 One in three people in India say they have no friends or relatives they could count on for help if they were in trouble.
When asked how many relatives and friends they could count on if they were in trouble and needed help, one-third of people in India (33%) say they have “none.” A large percentage (37%) say they have “1 to 5” friends or relatives they could count on to help them, while only about three in ten (28%) say they have either “6 to 10” (13%) or more than that (15%).