Climate Note · Apr 16, 2024
What do Americans want to know about climate change?
By Matthew Ballew, Marija Verner, Jennifer Carman, Teresa Myers, Seth Rosenthal, John Kotcher, Edward Maibach and Anthony Leiserowitz
Filed under: Audiences, Beliefs & Attitudes and Policy & Politics

Most Americans think global warming is happening and human-caused; however, there are important knowledge gaps and misconceptions. For example, only one in five Americans understand that nearly all climate scientists (more than 90%) agree that human-caused global warming is happening. Understanding these knowledge gaps and what people want to know can help communicators identify what topics to emphasize.
In Fall 2023, we asked Americans what questions they would ask a global warming expert if they had the opportunity. We found that overall, people would ask how scientists know that global warming is human-caused and what can be done to limit it.
In this analysis, we investigate how the questions people would ask an expert vary across different subgroups, including demographic and political groups and Global Warming’s Six Americas. The Six Americas framework categorizes people into six distinct audiences based on their opinions about climate change, ranging from the Alarmed (who are the most worried and supportive of action) to the Dismissive (who do not believe climate change is happening or human caused and are often opposed to action).
Respondents were asked, “If you had the opportunity to talk to an expert on global warming, which of the following questions would you like to ask?” Then, they were provided a list of 13 potential questions to choose from. Next, respondents were asked to choose the one question they were most interested in. The responses were then categorized into four overarching topics.
- Evidence includes three questions about the existence of global warming: “Is global warming really happening?” “How do you know that global warming is happening?” and “Is global warming a hoax?”
- Causes refers to two questions about the primary causes of global warming: “What causes global warming?” and “How do you know that global warming is caused mostly by human activities, not natural changes in the environment?”
- Impacts refers to three questions about the harms from global warming: “What harm will global warming cause?” “Will global warming harm people?” and “When will global warming begin to harm people?”
- Solutions includes five questions about the actions needed to reduce global warming: “What can the United States do to reduce global warming?” “What can I do to reduce global warming?” “How much would it cost the United States to reduce global warming?” “What can the nations of the world do to reduce global warming?” and “Is there still time to reduce global warming, or is it too late?”
Results
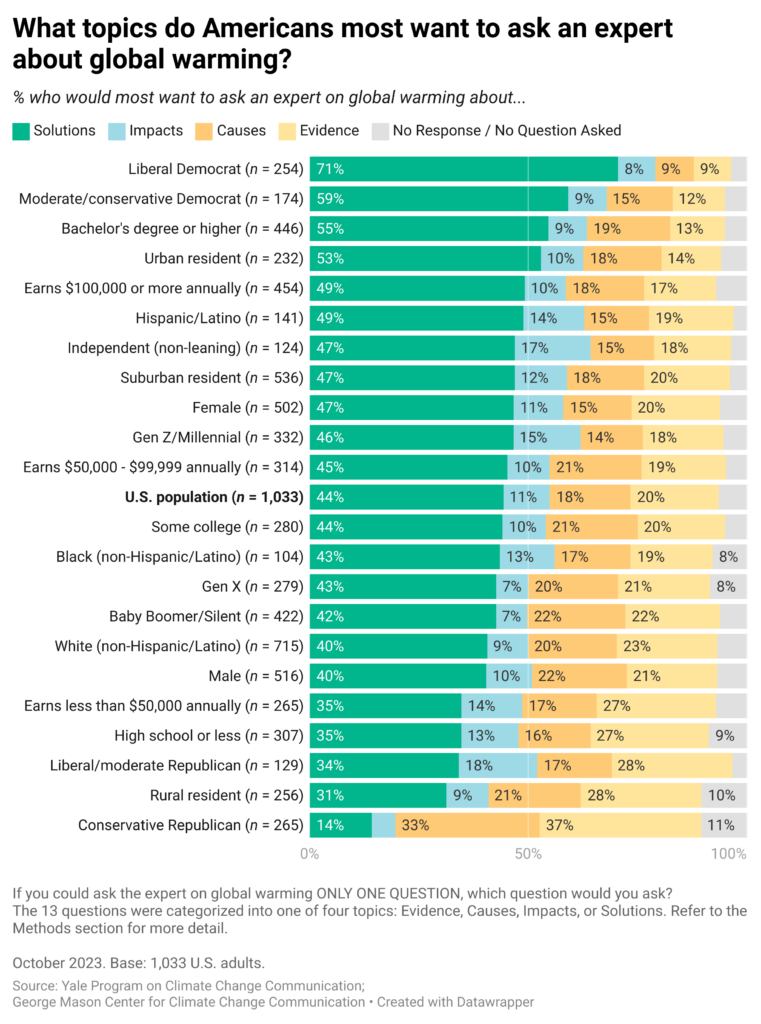
Americans are most interested in learning about solutions to global warming (44%), followed by evidence that it is happening (20%) or information about the causes (18%). Fewer Americans (11%) would ask first about the impacts of global warming.
The topics people would ask about differ across demographic and political groups. The groups most likely to ask about solutions include liberal Democrats (71%), moderate/conservative Democrats (59%), people with a Bachelor’s degree or higher (55%), and urban residents (53%). By contrast, the groups most likely to ask questions about evidence include conservative Republicans (37%), rural residents (28%), liberal/moderate Republicans (28%), people with high school or less education (27%), and people who earn less than $50,000 annually (27%). Additionally, compared to the general U.S. population, liberal/moderate Republicans (18%) and Independents (17%) are more likely to ask about impacts, and conservative Republicans (33%) are more likely to ask about causes.
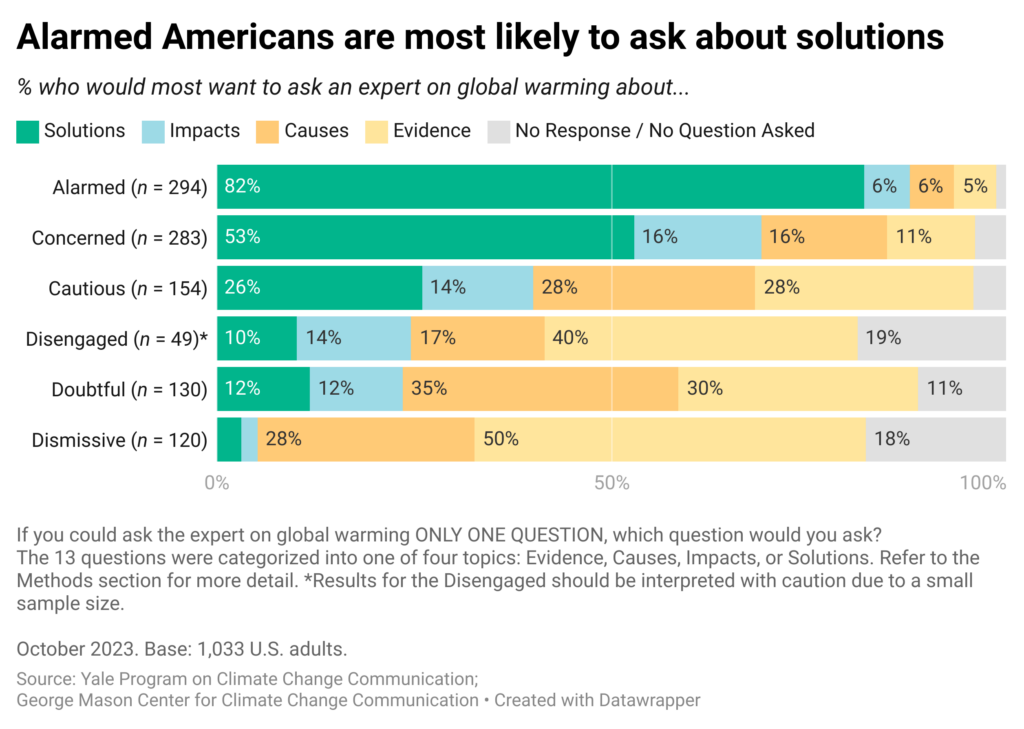
Topics also vary across Global Warming’s Six Americas. A large majority of the Alarmed (82%) and about half of the Concerned (53%) would ask about solutions, while fewer of the Cautious (26%), Disengaged (10%), Doubtful (12%), and Dismissive (3%) would do so. Conversely, these latter four segments most want to ask about either the causes of global warming or evidence that it is happening (about half or more of these segments would ask about either of these topics). Compared with the general U.S. population, the Dismissive (50%) are more likely to ask about the evidence, followed by the Disengaged (40%), Doubtful (30%), and Cautious (28%). Also, the Doubtful (35%) are more likely than the general U.S. population to ask about causes, followed by the Cautious (28%) and Dismissive (28%). The Concerned (16%) are more likely than the general U.S. population to ask about the impacts from global warming.
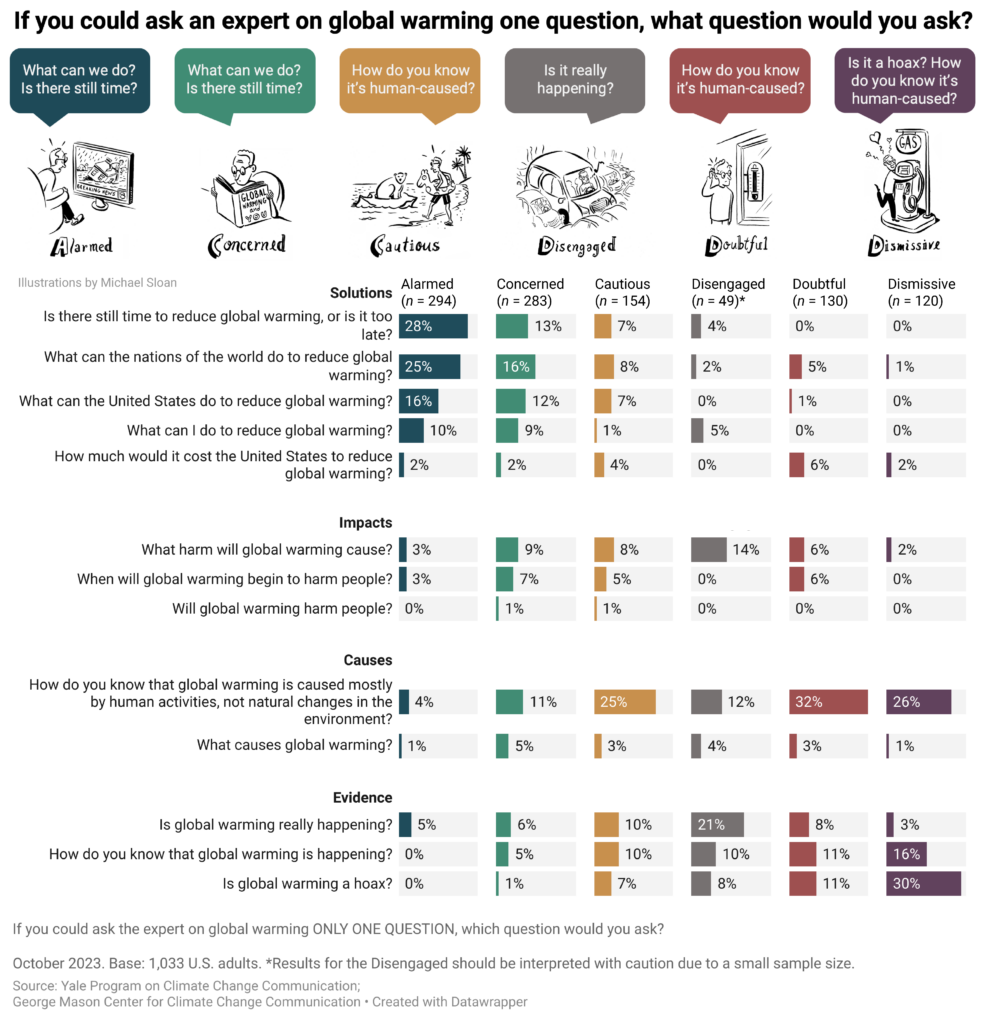
Looking at each of the 13 specific questions independently, the top questions the Alarmed and Concerned would ask are “Is there still time to reduce global warming, or is it too late?” (28% and 13% respectively), “What can the nations of the world do to reduce global warming?” (25% and 16%), and “What can the United States do to reduce global warming?” (16% and 12%). The Cautious would most likely ask “How do you know that global warming is caused mostly by human activities, not natural changes in the environment?” (25%) and the Disengaged would most likely ask “Is global warming really happening?” (21%). Similarly, the Doubtful would most likely ask “How do you know that global warming is caused mostly by human activities, not natural changes in the environment?” (32%) and the Dismissive would most likely ask “Is global warming a hoax?” (30%). The top questions people would ask across demographic and political groups are available in the data tables.
The results show that Americans are interested in learning more about climate change. However, the topics and specific questions people would ask a global warming expert differ by their prior beliefs about climate change and other characteristics like political views, education, and where people live. On average, people who are more worried about climate change (e.g., the Alarmed and Concerned) are more interested in learning about solutions, while those who are less worried (e.g., the Doubtful and Dismissive) are more interested in learning about the evidence that it is happening or human-caused.
Educating the U.S. public about solutions and the actions needed to reduce global warming (e.g., transitioning to clean energy) and what individuals can do (e.g., voting) can support audiences who are worried about climate change, including the Alarmed and Concerned. This is an important opportunity because few Americans search for solutions: only about three in ten say they look for global warming solutions several times a year or more often.
Among audiences who are less worried (particularly the Cautious and Doubtful), education about the evidence that global warming is happening and human-caused (e.g., the scientific consensus) can promote pro-climate views and support for action. These communications may also help protect against the influence of misinformation. Our research has found that when messaging about the scientific consensus is paired with “inoculation” strategies (e.g., debunking common misconceptions and emphasizing that some people are actively trying to mislead the public), it can counteract the negative effects of misinformation about climate change. We have also found that communicating about the human causes of global warming increases concern about climate change and support for climate policy.This sentence was added on April 23, 2024.
While Americans are less likely to ask first about the impacts of climate change, certain audiences (e.g., the Concerned, liberal/moderate Republicans, Independents) are more interested in this topic than the average American. Communicating about the harms of climate change is still critical, because many people tend to perceive climate risks as distant in time and space. Research has found that emphasizing climate change as an urgent threat happening “here and now” and causing harm to many people (e.g., children, local communities) can promote public support for climate action.
These findings indicate that it is vital to communicate the five key facts about climate change: scientists agree, it’s real, it’s us, it’s bad, and there’s hope.
Methods
The results of this report are based on Fall 2023 data from the Climate Change in the American Mind survey (n = 1,033) – a biannual nationally representative survey of U.S. public opinion on climate change conducted by the Yale Program on Climate Change Communication and the George Mason University Center for Climate Change Communication. Data were collected October 20 – 26, 2023. Survey data collection was conducted using the Ipsos KnowledgePanel®, a representative online panel of U.S. adults ages 18 and older. The questionnaires were self-administered online by respondents in a web-based environment.
Respondents were asked “If you had the opportunity to talk to an expert on global warming, which of the following questions would you like to ask?” (Yes, No) and provided a list of 13 questions. As a follow-up, respondents were provided with the list of questions they said “Yes” to, and asked “If you could ask the expert on global warming ONLY ONE QUESTION, which question would you ask?” The same questions were asked in the May 2011 wave of the Climate Change in the American Mind survey. The questions were categorized into one of four topics based on a coding scheme used in previous research that included nine of the 13 questions investigated in the present analysis. As presented here, they were categorized as Evidence (3 questions), Causes, (2 questions), Impacts (3 questions), or Solutions (5 questions). Respondents who did not choose any question or provided no response to the follow-up question were categorized as “No Response / No Question Asked.”
The audience segmentation analysis used the Six Americas Super Short Survey (SASSY) tool. Data for each survey wave were weighted to align with demographic parameters in the United States. Following Pew Research Center’s approach, generational cohort and year of birth were calculated based on the age of respondents at the time of data collection (Gen Z: 1997-2012; Millennial: 1981-1996; Gen X: 1965-1980; Baby Boomer: 1946-1964; and Silent Generation: 1928-1945). Because generational cohort classification was based on respondents’ age at the time they took the survey (rather than birth year, which was not known), some respondents on the cusp of two generations may be miscategorized. We are unable to describe the views of other racial/ethnic groups (including Asian Americans, Native Americans, and adults who identify with 2+ races) because of sample size limitations.
References to Republicans and Democrats include respondents who initially identify as either a Republican or Democrat, as well as those who do not initially identify as a Republican or Democrat but who say they “are closer to” one of those parties (i.e., “leaners”) in a follow-up question. The category “Independents” does not include any of these “leaners.”
In figures/data tables, bases specified are unweighted, while percentages are weighted to match national population parameters. Group differences were tested for statistical significance using the weighted proportions and unweighted sample sizes of each group. For tabulation purposes, percentage points are rounded to the nearest whole number. The average margin of error is +/- 3 percentage points at the 95% confidence interval for the full sample of U.S. adults (n = 1,033), +/- 5.7 for Alarmed (n = 294), +/- 5.8 for Concerned (n = 283), +/- 7.9 for Cautious (n = 154), +/- 14 for Disengaged (n = 49), +/- 8.6 for Doubtful (n = 130), and +/- 8.9 for Dismissive (n = 120). The margins of error for all other subgroups and the data tables used to develop the charts/figures can be found here.


