Climate Note · Apr 5, 2023
Global Warming’s Six Americas across age, race/ethnicity, and gender
By Matthew Ballew, Marija Verner, Jennifer Carman, Seth Rosenthal, Edward Maibach, John Kotcher and Anthony Leiserowitz
Filed under: Audiences and Beliefs & Attitudes

The Global Warming’s Six Americas framework is an audience segmentation approach to understanding the spectrum of people’s responses to global warming. The Alarmed and Concerned are the segments that are most likely to think that global warming is happening and are the most worried about it, while the Doubtful and Dismissive have the lowest belief that global warming is happening and are the least worried about it. For more information about Global Warming’s Six Americas, visit our recently published Climate Note.
In this analysis, we assess demographic group differences in climate opinion – and how they interact – by investigating Global Warming’s Six Americas across age, race/ethnicity, and gender. We combine data from the six latest waves of our Climate Change in the American Mind surveys spanning from 2020-2022 to maximize sample size (n = 6,211). We compare three generational cohorts: younger generations including Gen Z (born 1997 or later) and Millennials (born 1981-1996); Gen X (born 1965-1980); and older generations including Baby Boomers (born 1946-1964), the Silent Generation (born 1928-1945), and the Greatest Generation (born before 1928). We also investigate the views of the three largest racial/ethnic groups in the U.S.: White (non-Hispanic/Latino), Black (non-Hispanic/Latino), and Hispanic/Latino adults. We are unable to describe the views of other racial/ethnic groups (including Asian Americans, Native Americans, and adults who identify with 2+ races) because of sample size limitations.
Results
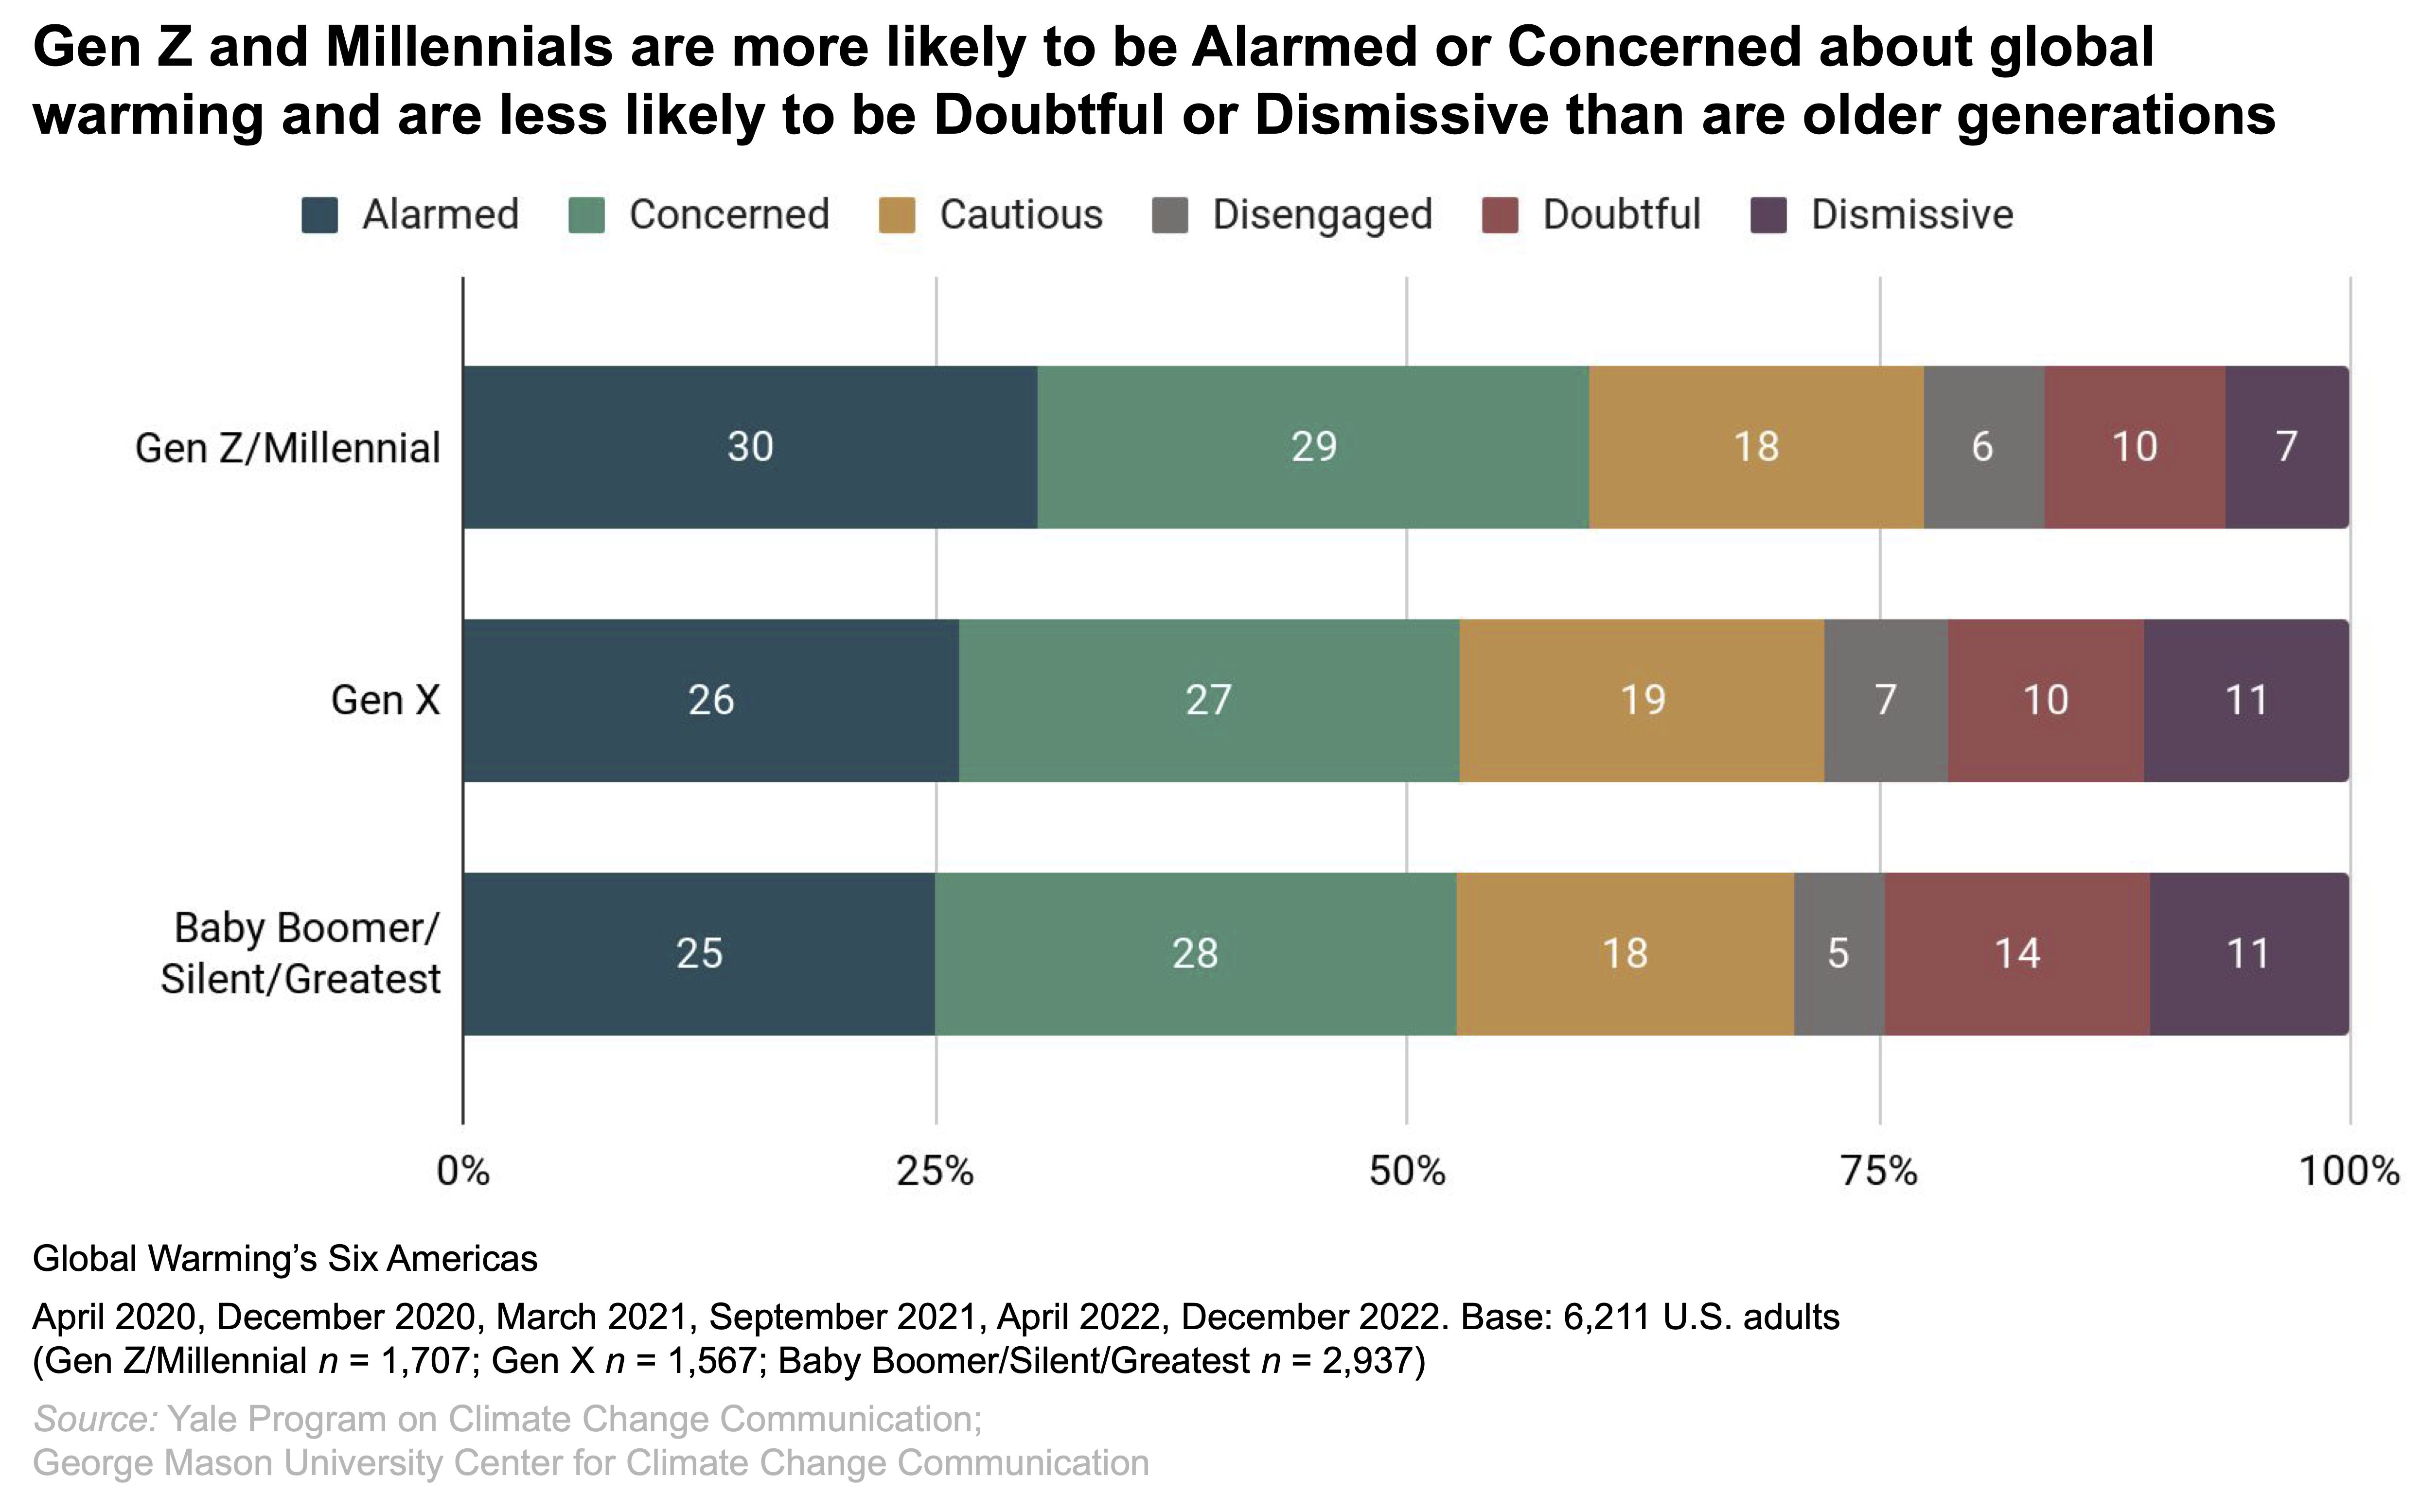
In many ways, young people are on the front lines of society’s response to climate change. Many youth-centered organizations, young climate activists, and social media influencers (e.g., EcoTok and other Climate Creators) are raising awareness about climate change and promoting greater climate action. In the U.S., younger Americans have become more worried and engaged with global warming than older Americans over the last decade.
Gen Z and Millennials (60%)Percentage points are rounded to the nearest whole number for tabulation purposes and summed categories (e.g., Alarmed + Concerned) are rounded after sums are calculated (e.g., 30.42% + 29.31% = 59.73%, which, after rounding would appear in this report as 60%). Percentages in a given chart may total slightly higher or lower than 100%. are more likely to be either Alarmed or Concerned about global warming than Gen X (53%), or Baby Boomers and older generations (53%). Gen Z and Millennials (16%) are also less likely to be either Doubtful or Dismissive than Gen X (21%), or Baby Boomers and older generations (25%).
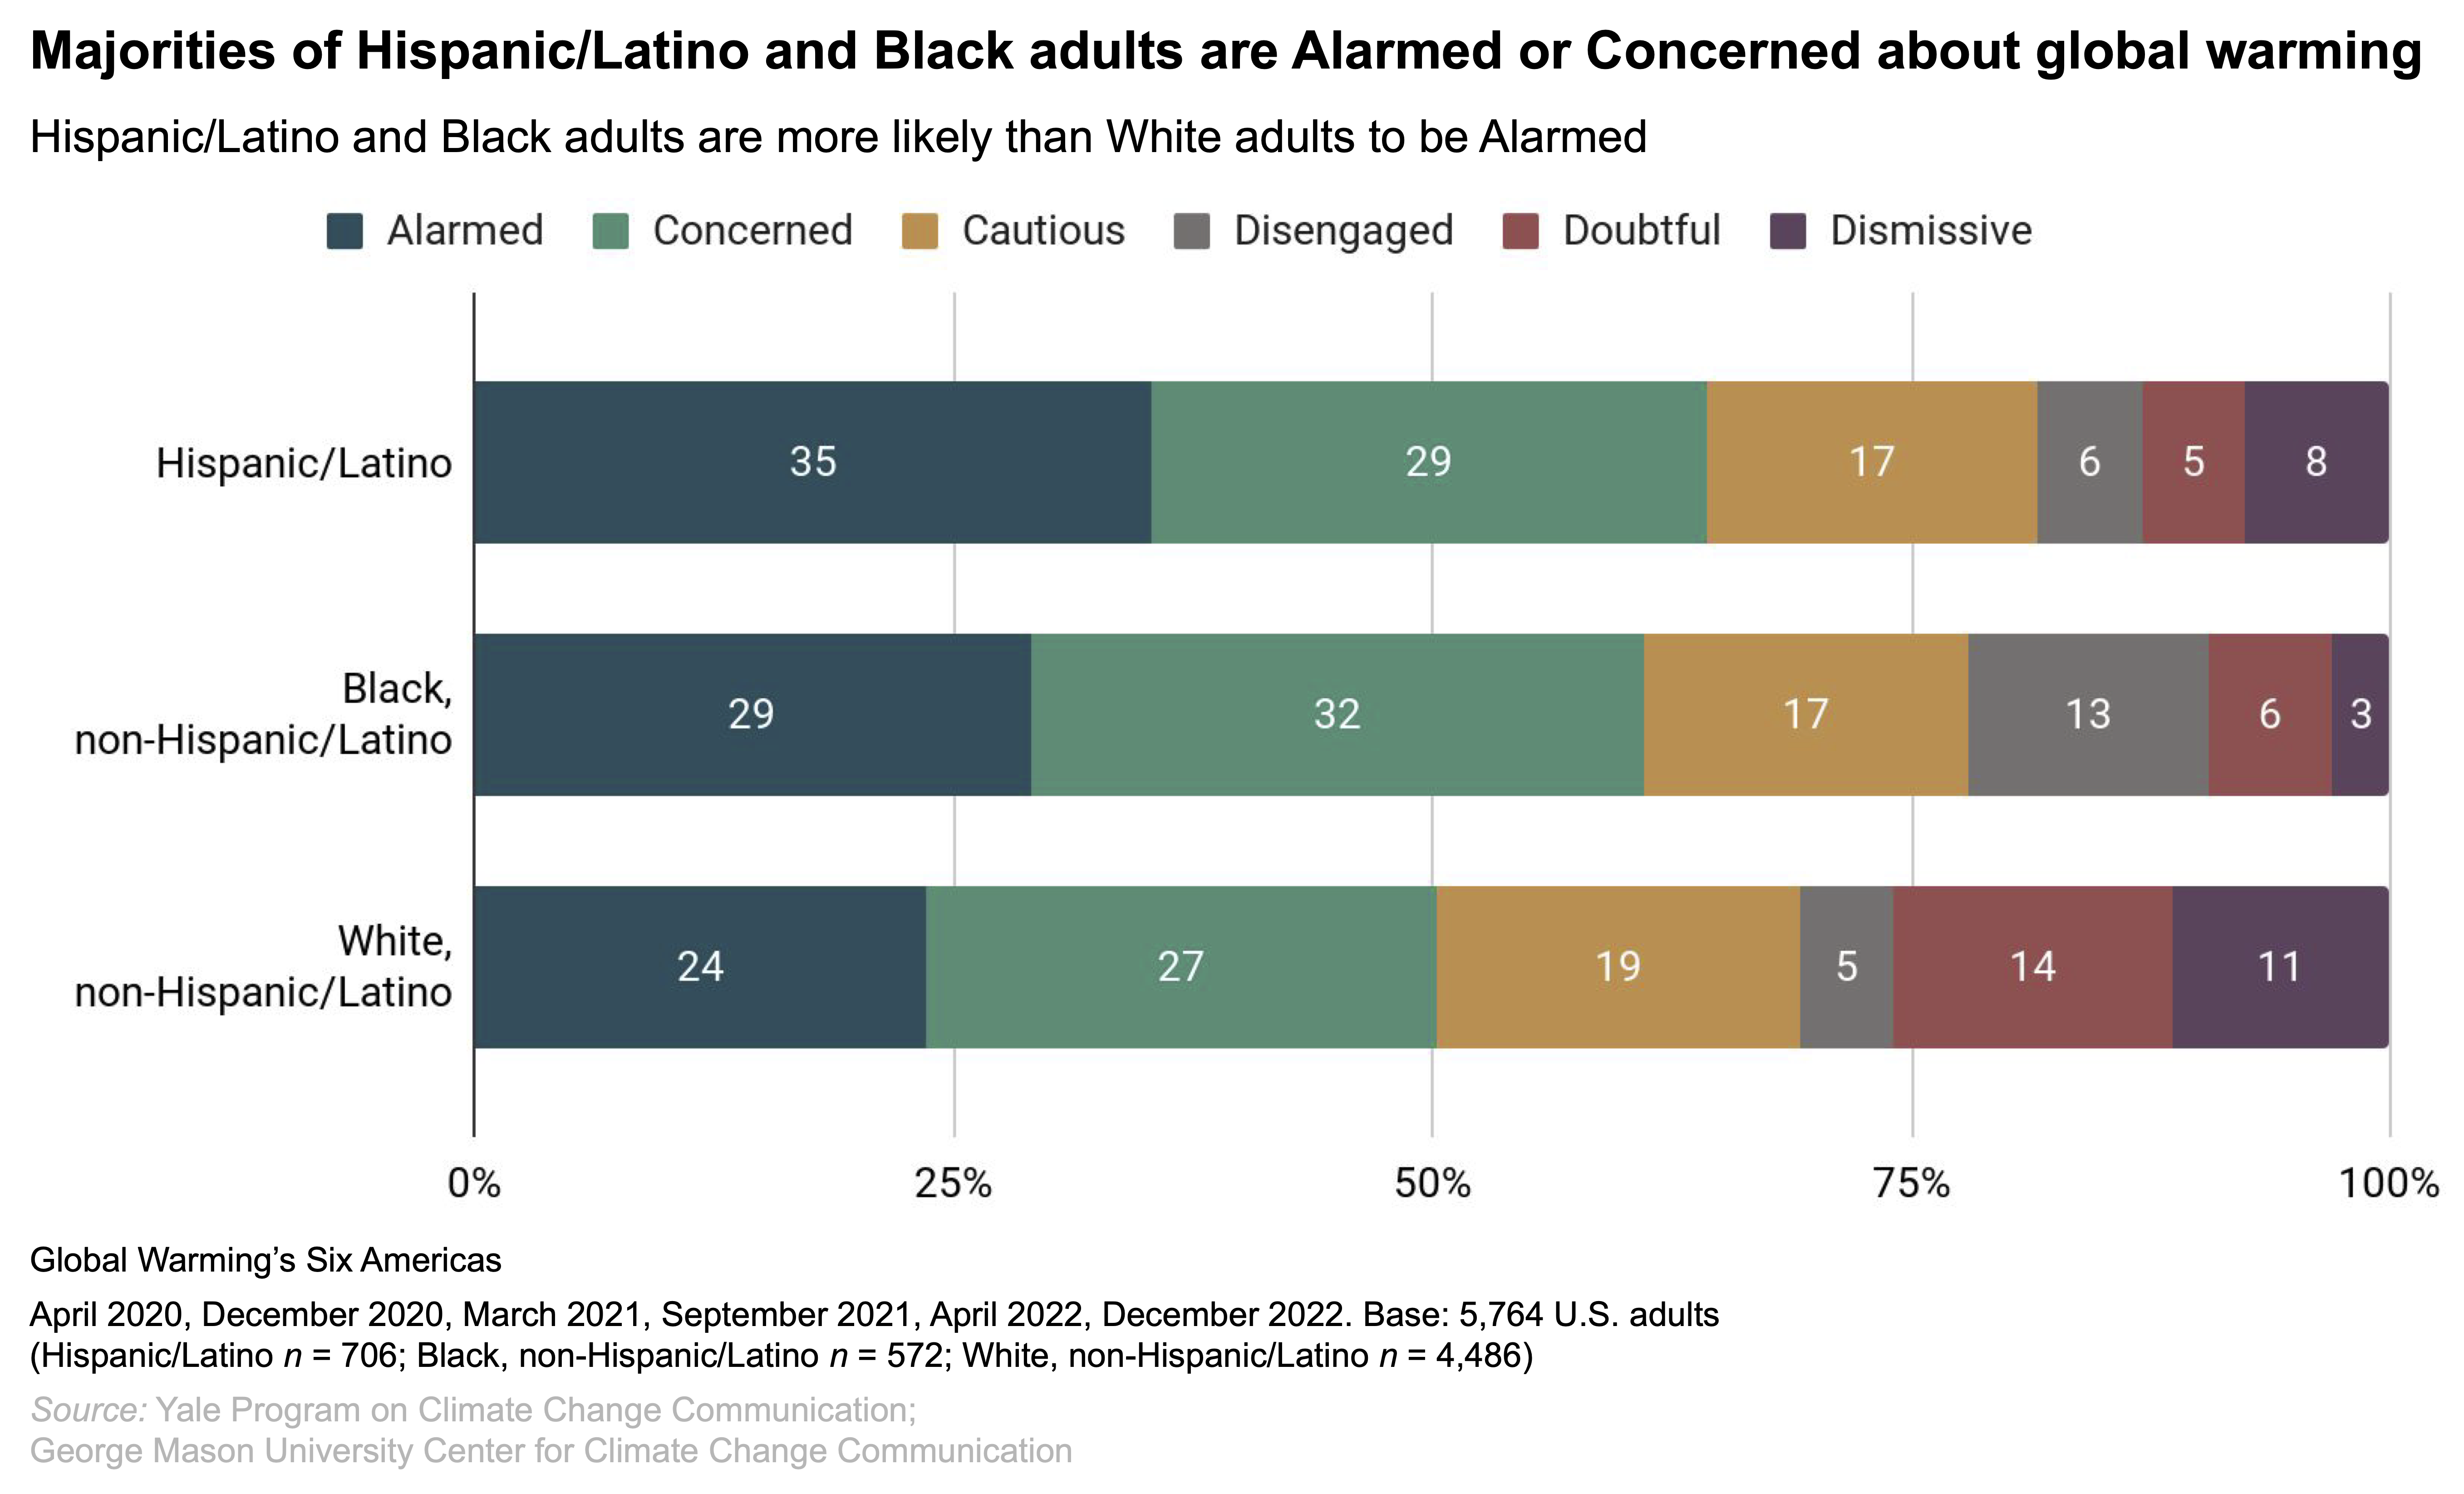
Majorities of Hispanic/Latino (64%) and Black adults (61%) in the U.S. are either Alarmed or Concerned about global warming, and they are more likely to be Alarmed or Concerned than are White adults (50%). Additionally, Hispanic/Latino (35%) and Black adults (29%) are more likely than White adults (24%) to be Alarmed, and Hispanic/Latino adults are the most likely to be Alarmed out of these three groups. White adults are nearly three times more likely to be Doubtful or Dismissive (26%) than are Black adults (9%), and twice as likely as Hispanic/Latino adults (13%). While Black adults are less likely to be Dismissive (3%) than the other groups, they are also more likely to be Disengaged (13%).
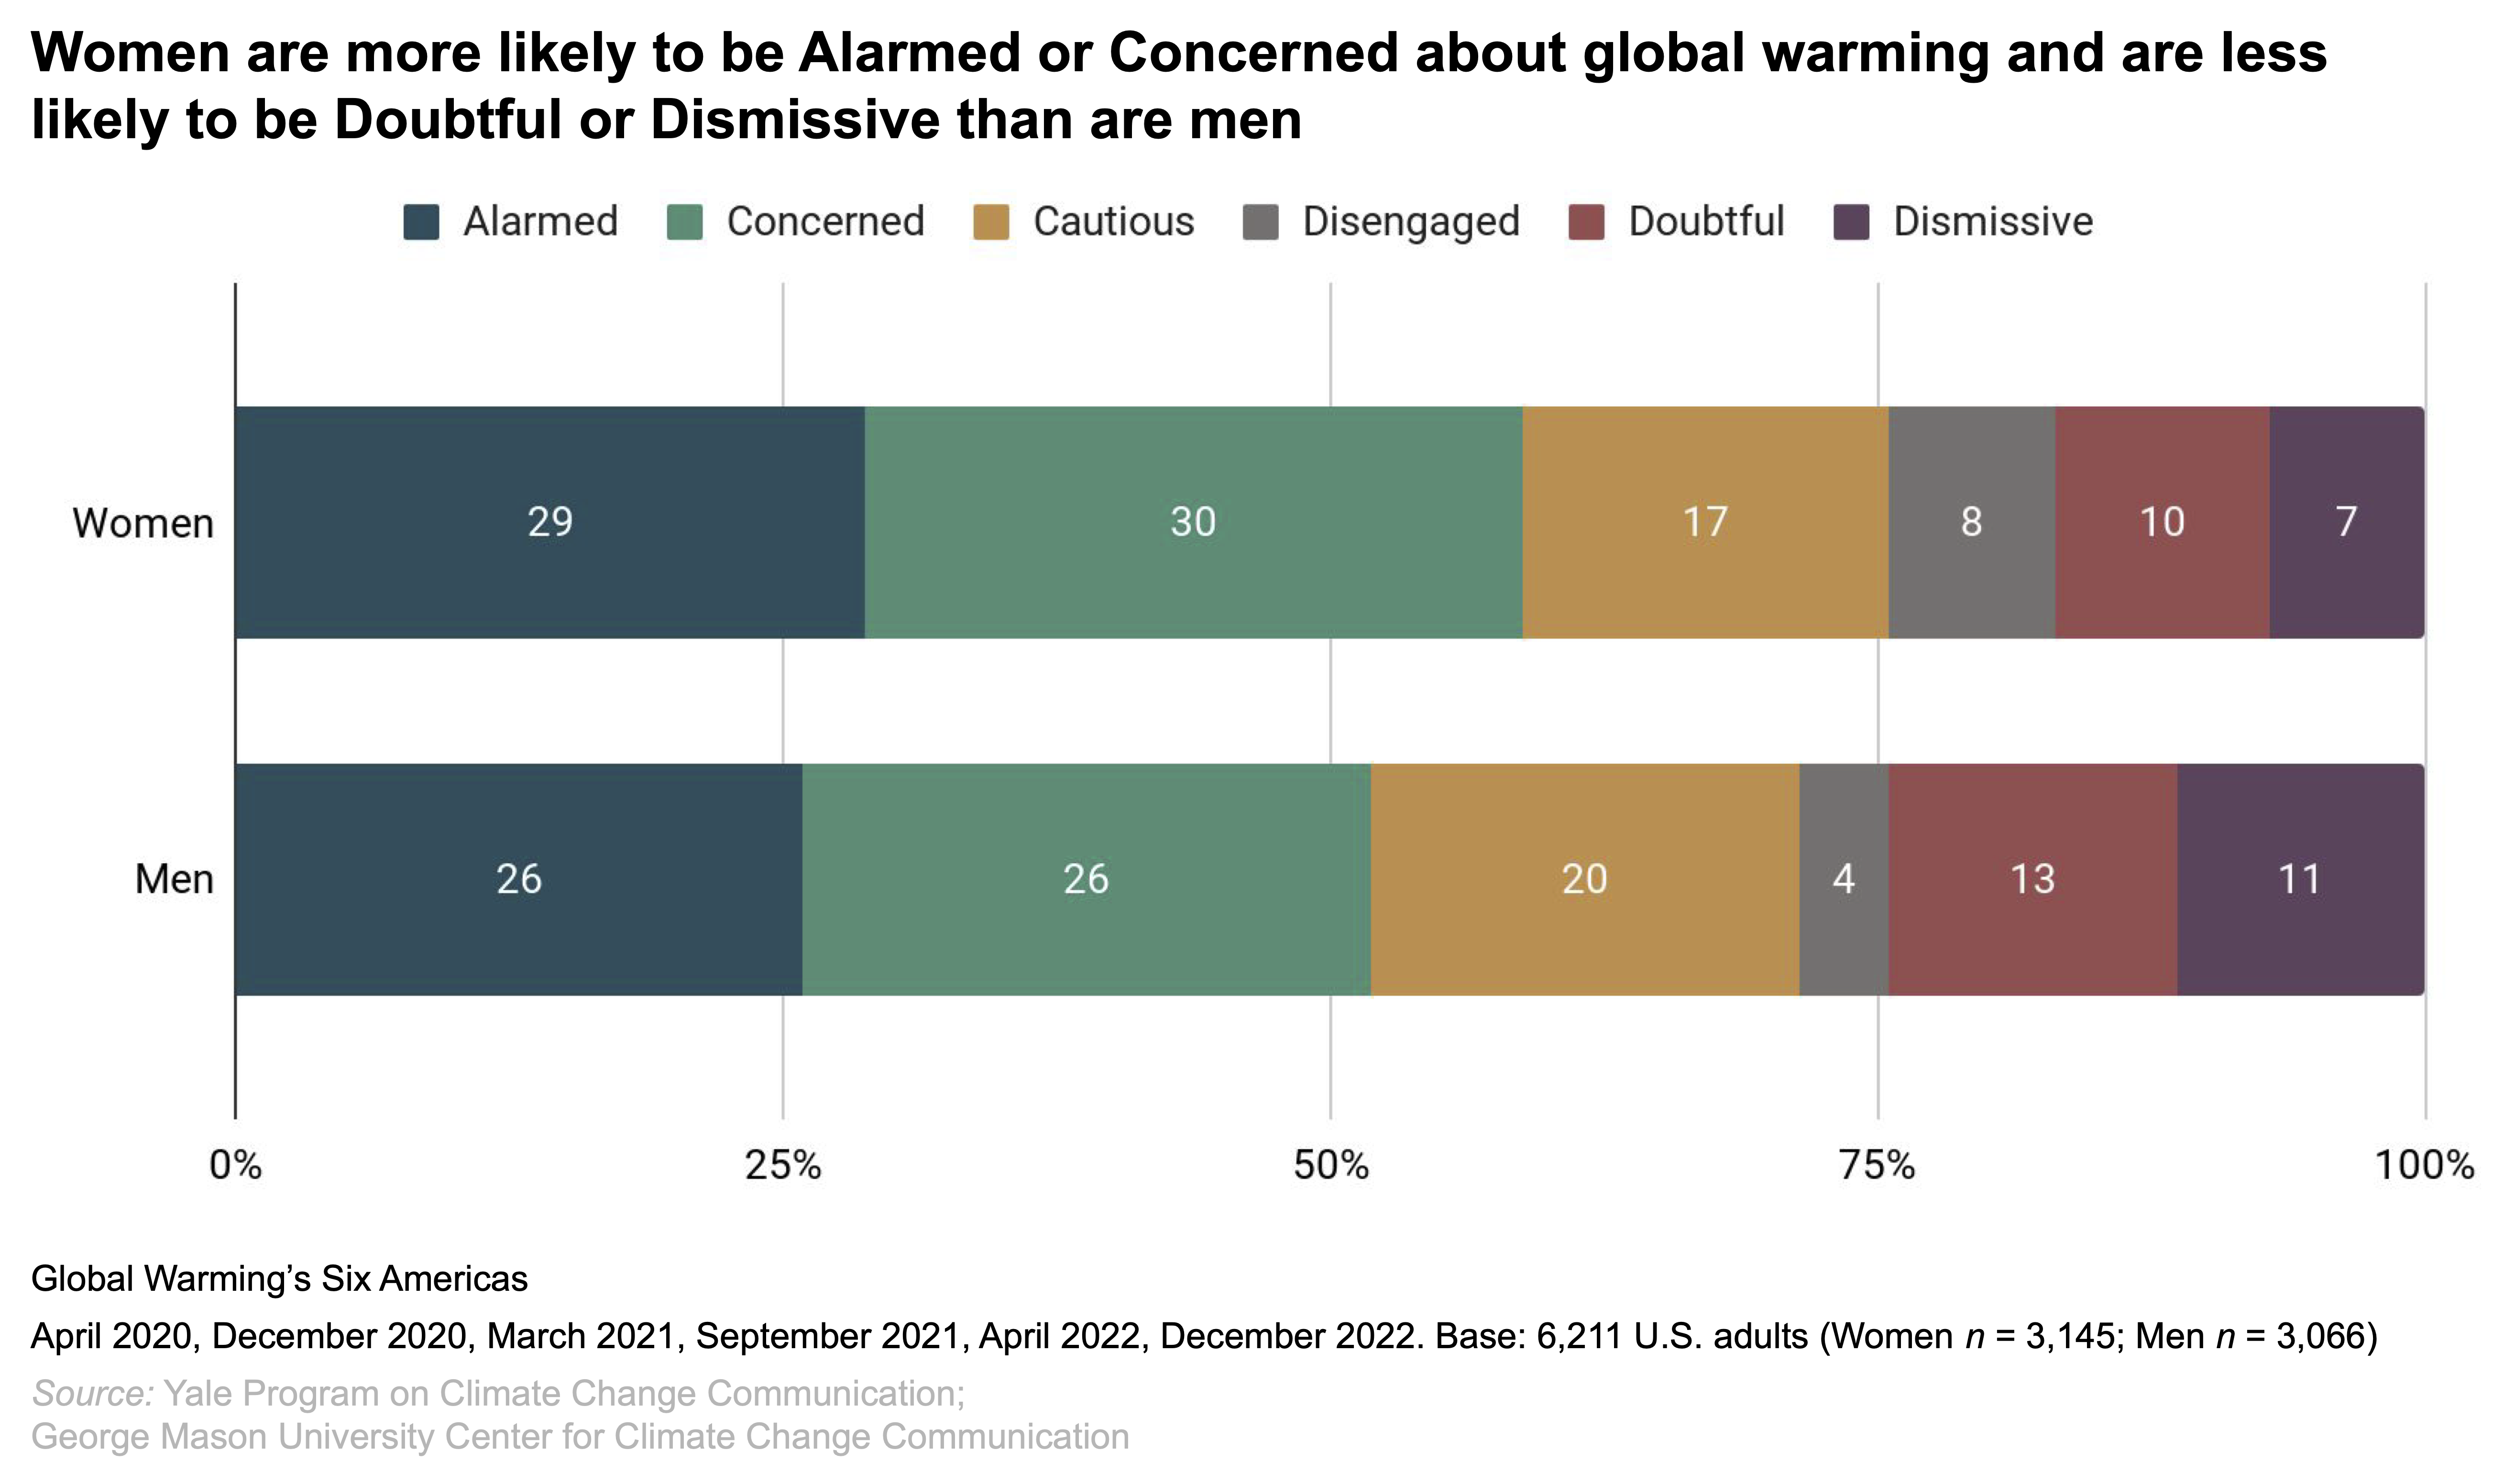
Women (59%) are more likely than men (52%) to be either Alarmed or Concerned, and they are also more likely to be Alarmed specifically (29% of women vs. 26% of men). Women (17%) are also less likely to be either Doubtful or Dismissive than men (24%). Additionally, while women (7%) are less likely than men (11%) to be Dismissive, a higher proportion of women (8%) than men (4%) are Disengaged.
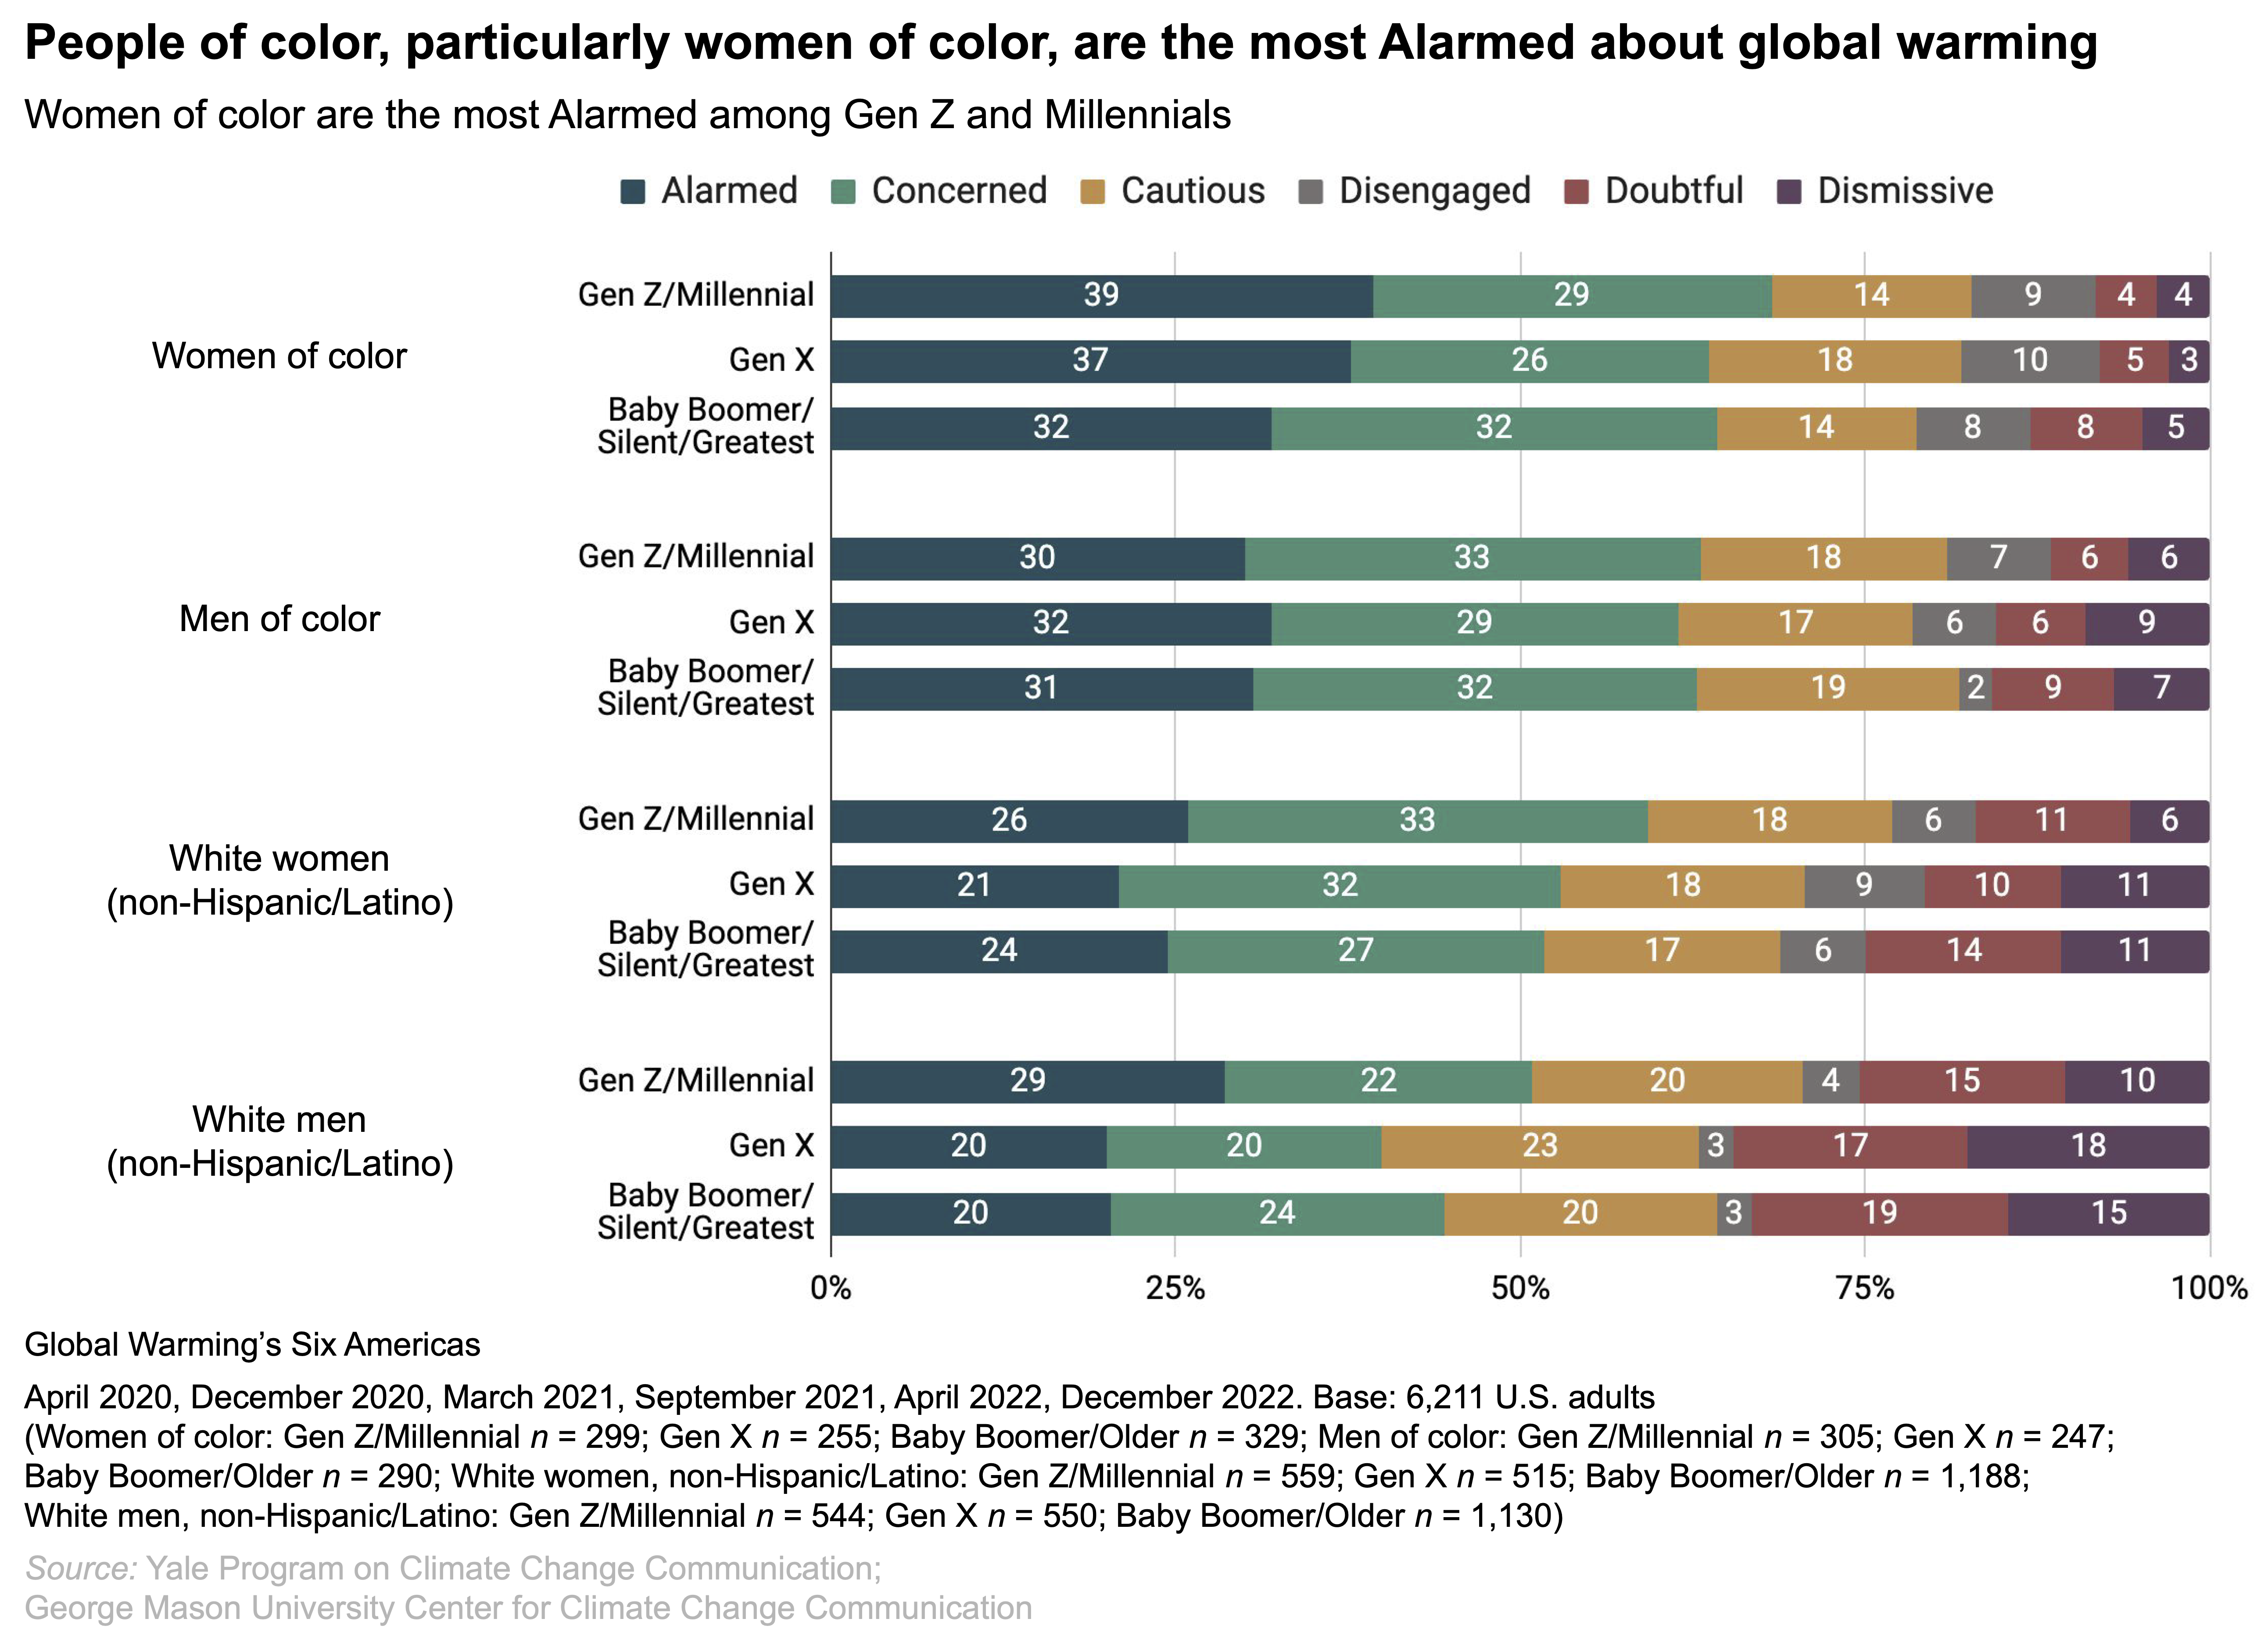
Combining age, race/ethnicity,To maximize sample size, respondents’ race/ethnicity was dichotomized to compare White (non-Hispanic/Latino) adults (n = 4,486) and people of color (Black, non-Hispanic/Latino adults, n = 572; Hispanic/Latino adults, n = 706; and adults with another race/ethnicity, n = 447, including non-Hispanic/Latino Asian Americans, Native Americans, and adults with 2+ races). and gender in the analysis reveals that people of color, particularly women of color, are the most Alarmed about global warming. This includes Gen Z and Millennial women of color (39% are Alarmed), Gen X women of color (37%), Gen X men of color (32%), and older generations of women of color (32%). Additionally, women of color are the most Alarmed among Gen Z and Millennials, and majorities of people of color across generations and genders are either Alarmed or Concerned.
These data highlight the importance of including diverse groups in climate policy and decision-making. These results suggest that people of color, women, and younger generations in general, and younger women of color in particular, represent key audiences to support and further engage in climate discussions and activism.
It is important to prioritize diversity and inclusion in the environmental movement, and to understand how to best engage diverse audiences who come from different backgrounds or hold multiple identities. This is particularly important because the environmental movement has had issues in the past with racism and white supremacy, and the groups most affected by environmental problems – including communities of color – are often underrepresented in environmental organizations. Given that social issues overlap and do not occur in isolation (e.g., racism, sexism, poverty, violence, educational inequities, health disparities), people with multiple identities have unique experiences, vulnerabilities, and adaptive capacities that are shaped by the intersection of systemic societal issues. In turn, people’s identities uniquely shape their responses to environmental problems. Younger generations of climate activists are increasingly advocating for the intertwining of social and climate justice movements for a more equitable, inclusive, and sustainable future. Justice-focused climate activists also prioritize including diverse cultural perspectives, such as Indigenous wisdom and Traditional Ecological Knowledge.
Importantly, the groups described here do not represent the full diversity of race/ethnicity and gender, and do not include other important identities/groups such as those related to socioeconomic status, sexual orientation, and disability. Furthermore, due to sample size limitations in national surveys, we are unable to describe the views of adults with another race/ethnicity, and some analyses combined distinct racial/ethnic groups into a single category, limiting our understanding of how these groups respond to climate change (e.g., Asian Americans, Indigenous populations). For instance, climate change also disproportionately affects the health of Asian American, Pacific Islander, and Indigenous communities, yet these groups remain understudied in climate research, and underrepresented in environmental organizations.
To further climate justice and advance the climate movement as a whole, it is critical to include, listen to, and amplify the voices of diverse groups to support their participation in climate policy and decision-making.
Methods
The results of this report are based on 2020-2022 data from six waves of the twice-yearly Climate Change in the American Mind survey (n = 6,211) – a representative national survey of U.S. public opinion on climate change conducted by the Yale Program on Climate Change Communication and the George Mason University Center for Climate Change Communication. Data were collected in April 2020 (n = 1,029), December 2020 (n = 1,036), March 2021 (n = 1,037), September 2021 (n = 1,006), April 2022 (n = 1,018), and December 2022 (n = 1,085). Survey data collection was conducted using the Ipsos KnowledgePanel®, a representative online panel of U.S. adults ages 18 and older. The questionnaires were self-administered online by respondents in a web-based environment. The audience segmentation analysis used the Six Americas Super Short Survey (SASSY) tool.
Data for each survey wave were weighted to align with demographic parameters in the United States, and then the six survey waves were averaged to take into account sample size differences. Following Pew Research Center’s approach, generational cohort and year of birth were calculated based on the age of respondents at the time of data collection (Gen Z: 1997-2012; Millennial: 1981-1996; Gen X: 1965-1980; Baby Boomer: 1946-1964; Silent Generation: 1928-1945; and Greatest Generation: before 1928). Because generational cohort classification was based on respondents’ age at the time they took the survey (rather than birth year, which was not known), some respondents on the cusp of two generations may be miscategorized. Respondents’ race/ethnicity was dichotomized to compare White (non-Hispanic/Latino) adults (n = 4,486) and people of color (Black, non-Hispanic/Latino adults, n = 572; Hispanic/Latino adults, n = 706; and adults with another race/ethnicity, n = 447, including non-Hispanic/Latino Asian Americans, Native Americans, and adults with 2+ races).
In figures/data tables, bases specified are unweighted, while percentages are weighted to match national population parameters. Percentage points are rounded to the nearest whole number for tabulation purposes. As a result, percentages in a given chart may total slightly higher or lower than 100%. Additionally, summed categories (e.g., Alarmed + Concerned) are rounded after sums are calculated (e.g., 30.42% + 29.31% = 59.73%, which, after rounding would appear in this report as 60%). The data tables used to develop the charts/figures can be found here.
Group differences were tested for statistical significance using the weighted proportions and unweighted sample sizes of each group. The average margin of error at the 95% confidence interval is +/- 1.2 percentage points for the full sample (n = 6,211). Margins of error at the 95% confidence interval for the subgroups are:
- Gen Z/Millennial +/- 2.4 percentage points (n = 1,707)
- Gen X +/- 2.5 percentage points (n = 1,567)
- Baby Boomer/Silent/Greatest +/- 1.8 percentage points (n = 2,937)
- Women +/- 1.7 percentage points (n = 3,145)
- Men +/- 1.8 percentage points (n = 3,066)
- White (non-Hispanic/Latino) +/- 1.5 percentage points (n = 4,486)
- Black (non-Hispanic/Latino) +/- 4.1 percentage points (n = 572)
- Hispanic/Latino +/- 3.7 percentage points (n = 706)
- Gen Z/Millennial women of color +/- 5.7 percentage points (n = 299)
- Gen Z/Millennial men of color +/- 5.6 percentage points (n = 305)
- Gen Z/Millennial White women (non-Hispanic/Latino) +/- 4.1 percentage points (n = 559)
- Gen Z/Millennial White men (non-Hispanic/Latino) +/- 4.2 percentage points (n = 544)
- Gen X women of color +/- 6.1 percentage points (n = 255)
- Gen X men of color +/- 6.2 percentage points (n = 247)
- Gen X White women (non-Hispanic/Latino) +/- 4.3 percentage points (n = 515)
- Gen X White men (non-Hispanic/Latino) +/- 4.2 percentage points (n = 550)
- Baby Boomer/Silent/Greatest women of color +/- 5.4 percentage points (n = 329)
- Baby Boomer/Silent/Greatest men of color +/- 5.8 percentage points (n = 290)
- Baby Boomer/Silent/Greatest White women (non-Hispanic/Latino) +/- 2.8 percentage points (n = 1,188)
- Baby Boomer/Silent/Greatest White men (non-Hispanic/Latino) +/- 2.9 percentage points (n = 1,130)