Peer-Reviewed Article · Aug 8, 2024
Can large language models estimate public opinion about global warming?
By Sanguk Lee, Tai-Quan Peng, Matthew Goldberg, Seth Rosenthal, John Kotcher, Edward Maibach and Anthony Leiserowitz
Filed under: Beliefs & Attitudes

We are pleased to announce the publication of a new article, “Can large language models estimate public opinion about global warming? An empirical assessment of algorithmic fidelity and bias” in the journal PLOS Climate.
Large language models (LLMs) such as ChatGPT are trained on vast amounts of human-generated data. This extensive training, along with sophisticated algorithms, enables LLMs to mimic human activities such as answering questions, writing code, and generating media content. The ability of LLMs to emulate human thoughts and behaviors raises an interesting question: can these models estimate human opinions about global warming? Because LLMs can generate simulated responses quickly and cheaply, researchers could use this technique to improve survey design by exploring new questions through these simulations.
In this research, we investigated the use of LLMs to estimate public opinion about global warming in the U.S. For example, if we give a LLM demographic and/or other information about people in a population, how accurately can it estimate public beliefs about global warming? This approach is different from conventional statistical models, like regressions, in that LLMs use semantic information (e.g., texts in survey questions, answers from open-ended questions) rather than numeric information. LLMs’ ability to process semantic information provides several benefits over conventional models. For instance, because LLMs can interpret the meaning of survey questions, they might be able to estimate how people would answer new questions that have never been asked before – something traditional statistical models cannot do.
Our research investigates how accurately LLMs can estimate public opinion compared to actual survey measures. We used two sets of data (2017 and 2021) from our Climate Change in the American Mind (CCAM) nationally representative surveys as benchmarks. We examined how the performance of LLMs is affected by two factors: (a) demographic characteristics and/or information related to public engagement with global warming in the U.S. and (b) the version of the LLM used. In one scenario, the LLMs were given basic demographic information such as age, gender, ethnicity, etc. about the American population. In another scenario, LLMs were given this demographic information plus national survey measures of perceived importance of global warming, how often Americans discuss global warming with family and friends, and awareness of the scientific consensus on global warming. Second, we compared the results from ChatGPT-3.5 and ChatGPT-4, to see if the model version used affected LLM estimates. The LLMs were instructed to act as interviewees and generate responses to global warming-related questions. For example, one prompt was: “You are a Black female aged between 30-44… Do you believe that global warming is happening?”
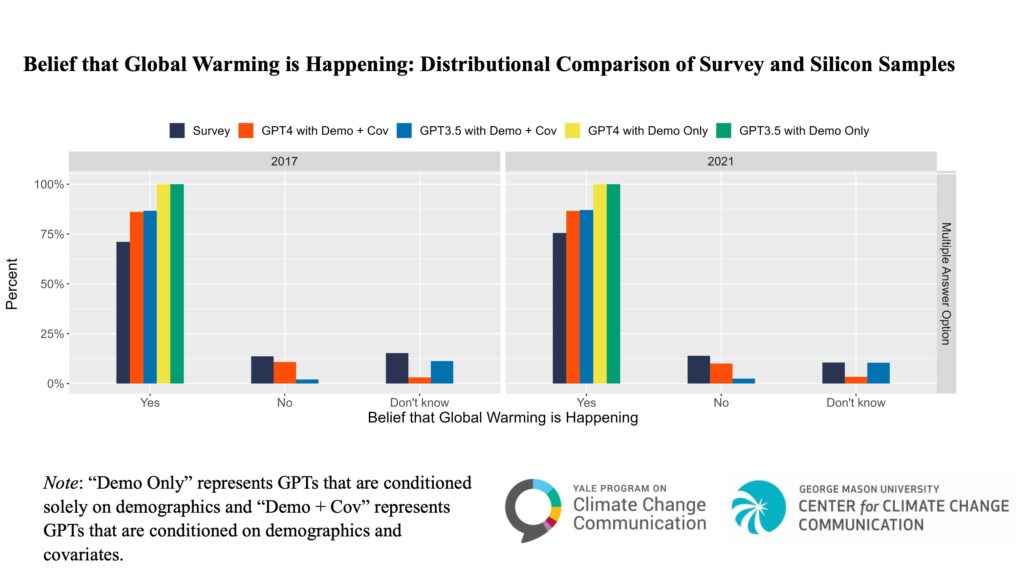
Using this information, we first examined how well ChatGPT could estimate public beliefs that global warming is happening. The figure below compares the distributions of answers from the national survey and four different tests of ChatGPT (Silicon Samples). The accuracy of ChatGPT estimates varied depending on the type of information they were provided and the model version used. Models that were given only demographic information performed poorly. For example, they estimated that nearly everyone in the U.S. believes global warming is happening, while actual survey data finds that only about 73% of American adults believe global warming is happening. In contrast, models that received both demographic information and additional information about global warming-related public opinion and behavior produced estimates that more closely matched the survey data. Additionally, ChatGPT-4 performed better than ChatGPT-3.5, indicating that this more advanced model improved accuracy.
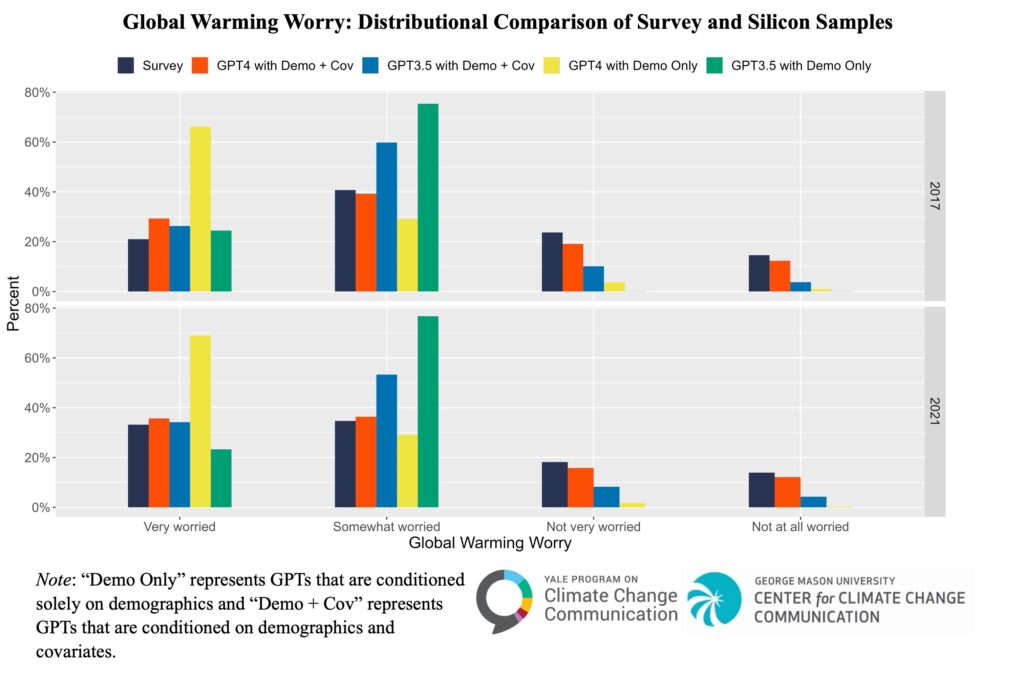
We observed similar patterns when estimating other public opinions, such as beliefs about the causes of global warming and worry about global warming. Models that received both demographic and global warming-related public opinion and behavior information outperformed demographics-only models, and ChatGPT-4 outperformed ChatGPT-3.5.
Although ChatGPT-4 with demographics and additional information was generally accurate in estimating overall public beliefs that global warming is happening, it was less accurate for certain demographic sub-populations such as Black Americans. For example, even the best performing combination (ChatGPT-4 with demographics + covariates) tended to underestimate the number of (Non-Hispanic) Black Americans who believe global warming is happening, indicating an underlying bias in the ChatGPT LLMs.
Overall, ChatGPT LLMs can estimate public opinion about global warming, particularly when the newest versions are provided with some domain-specific information. Despite this promising ability, outputs from LLMs should be carefully investigated to identify potential deficiencies and biases.
The full article with many other results is available here.