Climate Note · Jul 12, 2016
Global Warming’s Six Americas and the Election, 2016
By Connie Roser-Renouf, Edward Maibach, Anthony Leiserowitz and Seth Rosenthal
Filed under: Audiences, Policy & Politics and Behaviors & Actions
Summary
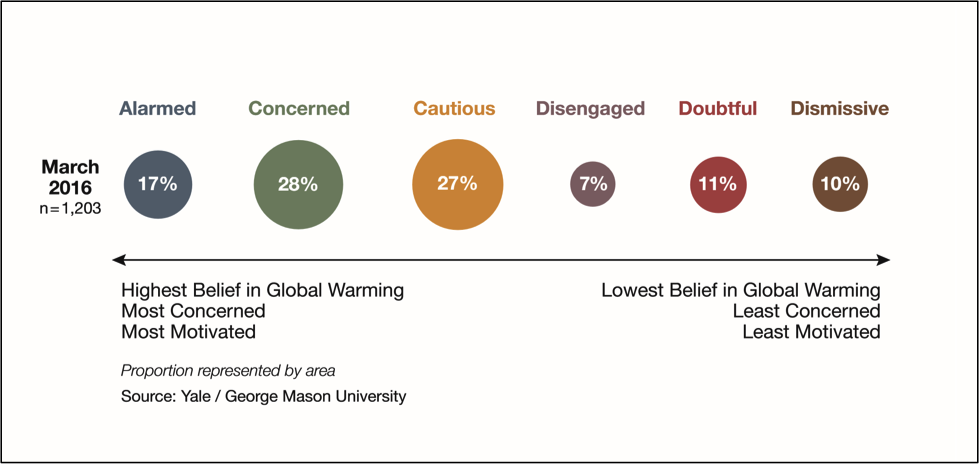
Americans hold diverse views on global warming, falling into six distinct groups – Global Warming’s Six Americas – that range in their beliefs, attitudes, policy preferences and behavior. Climate change is a top-tier issue in the 2016 presidential election only for Americans who are in the most engaged of the six groups – the Alarmed (a group constituting 17% of the U.S. population and 19% of registered voters). However, presidential candidates who support taking action to reduce global warming are also more likely to earn the votes of a large majority of the Concerned (28% of the population and 29% of registered voters) and a substantial minority of the Cautious (27% of the population and 25% of registered voters). Conversely, candidates who oppose taking action on global warming are less likely to earn the votes of Americans in three of the six groups. Only the Dismissive (10% of the population and of registered voters) are more likely to vote for a candidate who opposes action on global warming.
Global Warming’s Six Americas in March, 2016
The most engaged group are the Alarmed, who are very worried about the issue and strongly support government and individual action to address it. At the opposite end of the spectrum are the Dismissive, who do not believe global warming is real and are likely to believe in various conspiracy theories about the issue (e.g., it’s a scientific hoax, etc.).
In March of 2016, 45 percent of Americans belonged to the two most engaged segments, the Alarmed and Concerned. One in three (34%) belonged to the two middle segments, the Cautious and Disengaged; these groups have thought little about the issue and see it as having little personal relevance. The remaining 21 percent belonged to the two groups that are skeptical and tend to oppose climate action, the Doubtful and Dismissive.
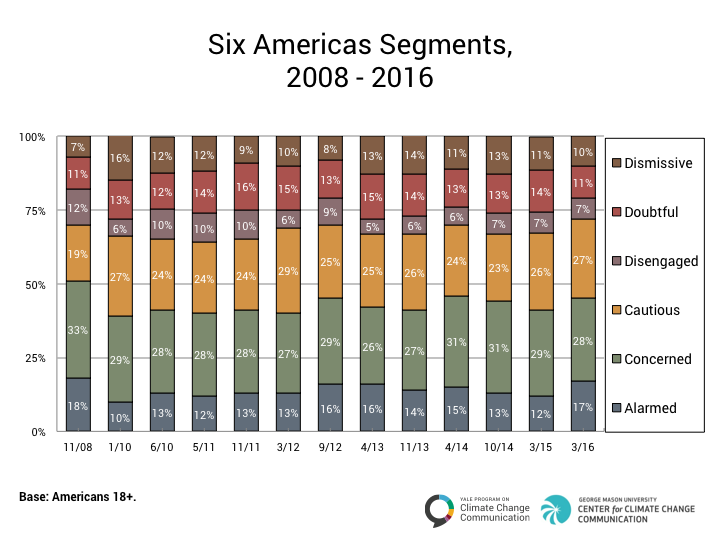
The proportion of Americans in the Alarmed segment increased by five percentage points over the past year, and is now comparable to proportion found in the fall of 2008, when the segments were first identified and global warming concern was at a high point nationally.
Voting Issue Priorities Among the Six Americas
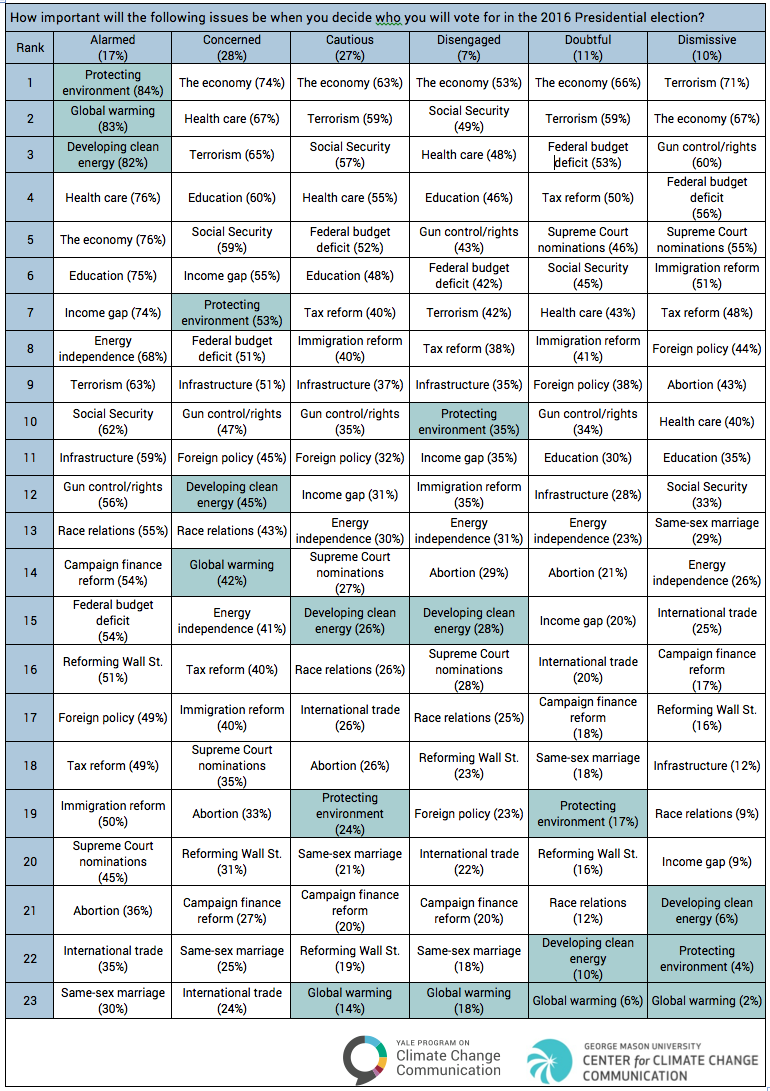
As Americans decide which candidate to support in the upcoming presidential election, global warming, environmental protection and clean energy production are central to the decisions of some segments and largely irrelevant to others. More than 80 percent of the Alarmed say these issues will be very or extremely important in their voting decisions. Among the Concerned, half (53%) consider environmental protection to be very or extremely important, and more than 40 percent consider clean energy and global warming the same. Among the remaining segments, however, global warming is the least important issue of the 23 assessed, and only a third or fewer say environmental protection and developing clean energy will be very or extremely important in their vote.
Presidential Voting Preferences
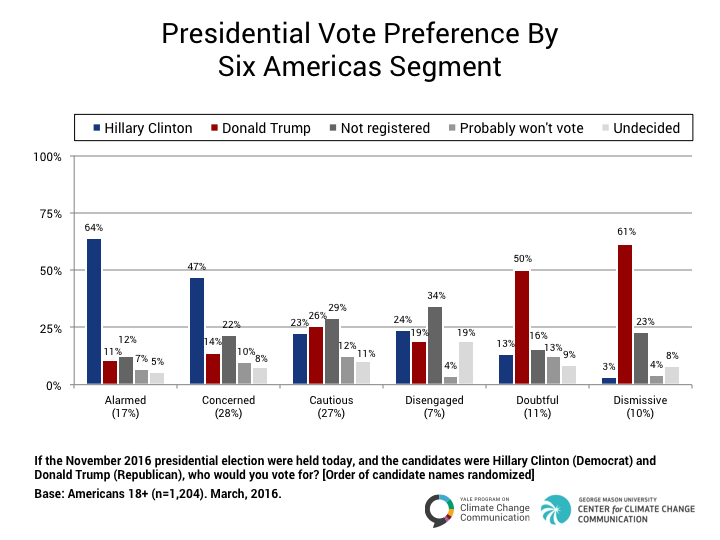
Vote preferences are strongly linked to Six Americas segment; two out of three Alarmed (64%) say they plan to vote for Hillary Clinton, and three out of five Dismissive (61%) prefer Donald Trump. Close to half of the Concerned prefer Clinton, and half of the Doubtful prefer Trump. The Cautious and Disengaged are more divided in their vote preferences, and a plurality of both segments say they are not registered voters.
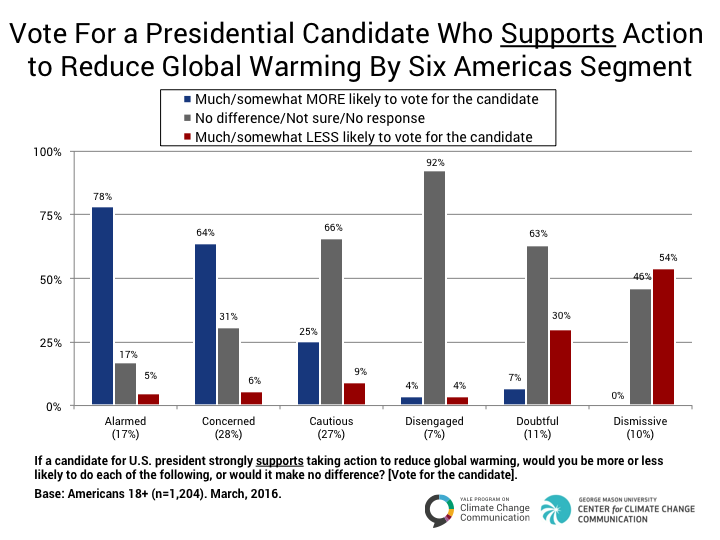
More than three-quarters of the Alarmed and close to two-thirds of the Concerned say they would be more likely to vote for a candidate who strongly supports taking action to reduce global warming. Majorities of the Cautious, Disengaged and Doubtful say it would make no difference to their vote or they’re not sure whether it would make a difference. Only among the Dismissive do a majority (54%) say that a candidate’s support for action to reduce global warming would make them less likely to vote for the candidate.
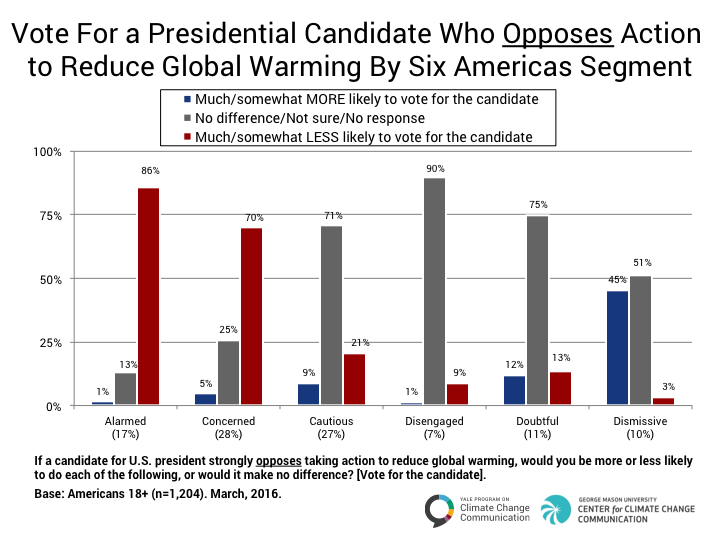
Large majorities of the Alarmed and Concerned say they would be less likely to vote for a candidate who opposes action to reduce global warming. Majorities of the Cautious, Disengaged and Doubtful say it would make no difference to their vote or they’re not sure whether it would make a difference. Even among the Dismissive – the segment most convinced that global warming is not real – half (51%) indicate that opposition to action would make no difference to their vote, while slightly less than half – 45 percent – say it would increase the likelihood that they would vote for the candidate.
Willingness to Join a Climate Action Campaign
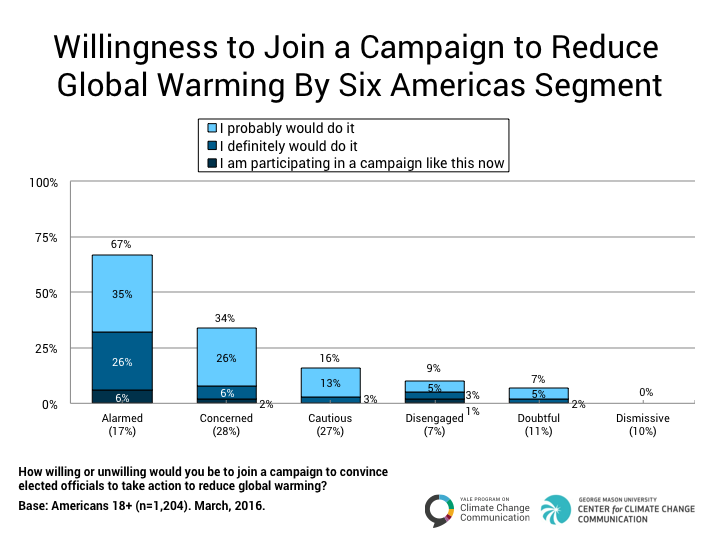
Close to a third of the Alarmed (32%) say they are either currently participating in a campaign to convince elected officials to take action to reduce global warming (6%) or that they definitely would do so (26%). Another third (35%) say they probably would join. Very few members of the remaining segments say they are currently participating in a campaign (3% or less) or that they would definitely join (6% or less). A quarter of the Concerned (26%), however, say they probably would join, as do 13 percent of the Cautious.
Survey Method
Data are based on a nationally representative survey of 1,204 American adults, aged 18 and older. The survey was conducted March 18–31, 2016. All questionnaires were self-administered by respondents in a web-based environment. The survey took, on average, about 26 minutes to complete.
The sample was drawn from GfK’s KnowledgePanel®, an online panel of members drawn using probability sampling methods. Prospective members are recruited using a combination of random digit dial and address-based sampling techniques that cover virtually all (non-institutional) resident phone numbers and addresses in the United States. Those contacted who would choose to join the panel but do not have access to the Internet are loaned computers and given Internet access so they may participate. The sample therefore includes a representative cross-section of American adults—irrespective of whether they have Internet access, use only a cell phone, etc. Key demographic variables were weighted, post survey, to match US Census Bureau norms.
The survey instrument was designed by Anthony Leiserowitz, Geoff Feinberg, and Seth Rosenthal of Yale University, and Edward Maibach and Connie Roser-Renouf of George Mason University.
Sample details and margins of error
All samples are subject to some degree of sampling error—that is, statistical results obtained from a sample can be expected to differ somewhat from results that would be obtained if every member of the target population were interviewed. Average margins of error each wave, at the 95% confidence level, are plus or minus 3 percentage points except where noted.
- March 2016: Field March 18–31 (n=1,204).
- Alarmed (n=212). Margin of error plus or minus 7 percentage points.
- Concerned (n=348). Margin of error plus or minus 5 percentage points.
- Cautious (n=320). Margin of error plus or minus 6 percentage points.
- Disengaged (n=64). Margin of error plus or minus 12 percentage points.
- Doubtful (n=137). Margin of error plus or minus 8 percentage points.
- Dismissive (n=122). Margin of error plus or minus 9 percentage points.
- October 2015: Fielded September 30–October 19 (n=1,330).
- March 2015: Fielded February 27–March 10 (n=1,263).
- October 2014: Fielded October 17–28 (n=1,275).
- April 2014: Fielded April 15–22 (n=1,013).
- November 2013: Fielded November 23–December 9 (n=830).
- April 2013: Fielded April 10–15 (n=1,045).
- September 2012: Fielded August 31–September 12 (n=1,061).
- March 2012: Fielded March 12–March 30 (n=1,008).
- November 2011: Fielded October 20–November 16 (n=1,000).
- May 2011: Fielded April 23–May 12 (n=1,010).
- June 2010: Fielded May 14–June 1 (n=1,024).
- January 2010: Fielded December 24, 2009–January 3, 2010 (n=1,001).
- November 2008: Fielded October 7–November 12 (n=2,164).
- Data were collected over two periods: from October 7–October 20 and from October 24–November 12. Margin of error plus or minus 2 percentage points.
Rounding error
For tabulation purposes, percentage points are rounded off to the nearest whole number. As a result, percentages in a given chart may total slightly higher or lower than 100%. Summed response categories (e.g., “much more likely” + “somewhat more likely”) are also rounded.
