Peer-Reviewed Article · Apr 6, 2015
Yale Climate Opinion Maps
By Anthony Leiserowitz, Peter Howe, Matto Mildenberger and Jennifer Marlon
Filed under: Beliefs & Attitudes and Policy & Politics
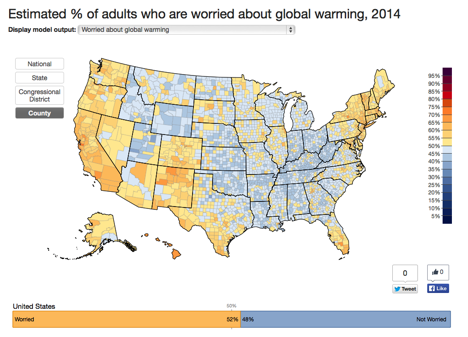
We are pleased to announce a new interactive mapping tool called “Yale Climate Opinion Maps” (YCOM) and an accompanying peer-reviewed paper in the journal Nature Climate Change. This tool allows users to visualize and explore differences in public opinion about global warming in the United States in unprecedented geographic detail, as the map of public worry about global warming below illustrates. As you can see, 52% of Americans are worried about global warming. But this national number glosses over the enormous geographic diversity in public opinion across the country – diversity that is revealed for the first time in these maps.
The estimates contained in the tool are based on a geographic and statistical model developed by our research team at Yale and Utah State University. The model uses the large quantity of national survey data that we have collected over the years — over 13,000 individual survey responses since 2008 — to estimate differences in opinion between geographic and demographic groupings. As a result, we are able to provide high-resolution estimates of public climate change understanding, risk perceptions, and policy support in all 50 states, 435 Congressional districts, and 3,000+ counties across the United States. We validated the model estimates with a variety of techniques, including independent state and city-level surveys. Our independent survey validation tests found that the estimates are accurate within +/- 3 percentage points at the state level, and +/- 6 percentage points at the city level. The accuracy of the model estimates is higher for geographic areas with larger populations.
We undertook this project because most of the action to reduce greenhouse gas emissions and prepare for climate impacts is happening at the state and local levels of American society. Yet elected officials, the media, advocates, and educators currently know little about public climate change opinion at these sub-national levels. State and local surveys are costly and time intensive, and as a result most public opinion polling is only done at the national level. The estimates from our model provide a new way to understand and visualize the geographic diversity in public opinion across the country; something that is not feasible using standard survey techniques.
Please explore the maps by clicking on your state, congressional district, or county, and compare the results across questions and with other geographic areas. Keep in mind, however, that the margin of error increases as you move to smaller geographic scales (i.e., from state to county levels). As a result, it is not possible to know whether a county estimate of 42% is statistically different than an estimate in a nearby county of, say, 44%.
For additional details on the methodology behind the tool (multilevel regression and post-stratification) and some key findings, please see the published paper:
If you have a subscription, you can access the paper at the Nature Climate Change website. If you do not, please request a copy from us with the subject line: YCOM Paper Request.
This research and website are funded by the Skoll Global Threats Fund, the Energy Foundation, the 11th Hour Project, the Grantham Foundation for the Protection of the Environment, and the V.K. Rasmussen Foundation.